Passenger Air Travel’s Post-Pandemic Takeoff
By Big Data Federation, Inc.

Two long years ago, COVID-19 reared its ugly head, making us all stay at home and stymieing commercial passenger air travel. Unsurprisingly, the airline industry’s share of GDP (typically ~5%) took a nosedive, dropping by more than half.
Fortunately, 2022 is auguring well for the resurgence of aerial bus traffic, with passenger revenues reaching a record $7.9B (+44.8% MoM) in March, the highest since shelter-in-place began and a clear step towards business as usual ($9.3B in 3/19). These higher sales were driven by both an increase in airfares (+16.4% MoM) and passenger volume (+25.5% MoM).
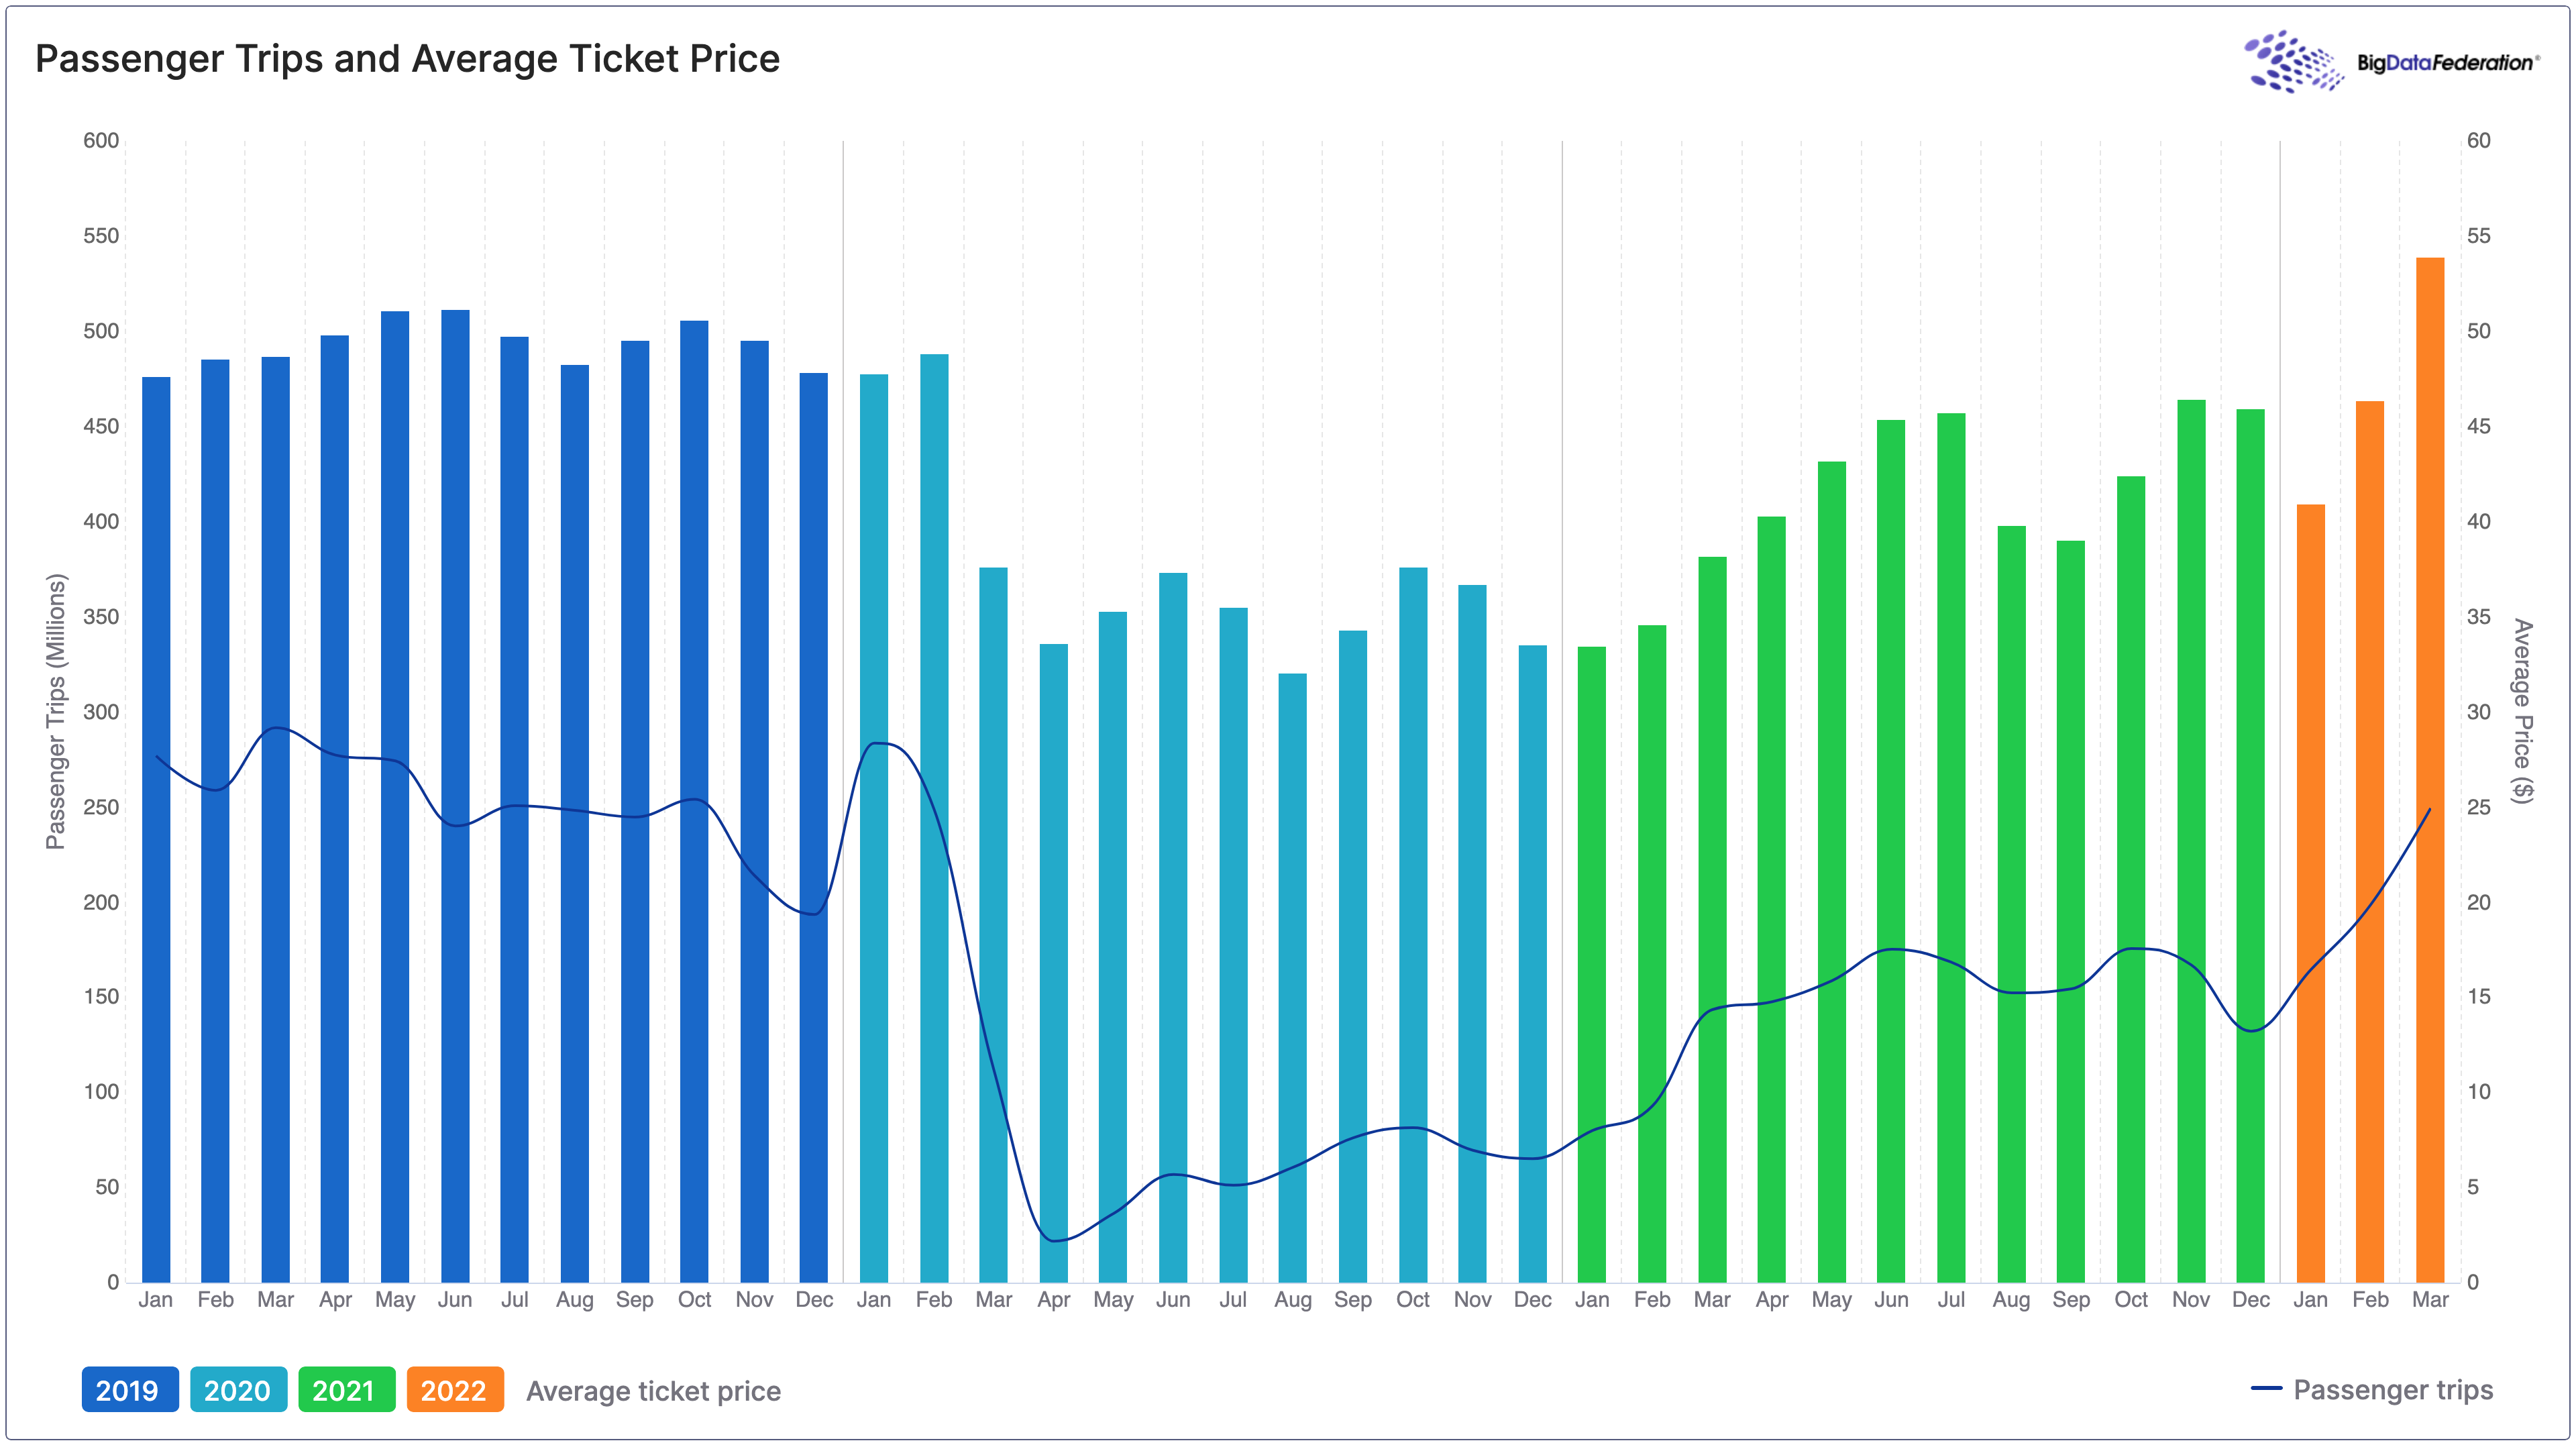
With substantially elevated demand, air carriers have been able to charge significantly higher prices (+10.8% YoY3), serving in part to offset elevated jet fuel costs and recoup pandemic-related losses.
Further demonstrating the growing willingness of travelers to splurge on trips, payments for ancillary services to enhance a flight journey – such as premium seats, in-flight entertainment, lounge access, and meals – increased +26.3% MoM (as represented by EMD sales).
Of note, March is when the airline fares component of the Consumer Price Index began showing up as a major contributor to inflation. In April, its impact further grew when it became inflation’s largest driver, a month which also saw the shift of inflation drivers from goods to back to services.
| Data | MoM | YoY | YoY3* |
| U.S. Airline Revenue | +44.8% | +179.9% | -15.5% |
| Average Ticket Price | +16.4% | +41.2% | +10.8% |
| Passenger Trips | +25.5% | +73.8% | -14.5% |
| Domestic Bookings | +25.3% | +63.8% | -9.5% |
| International Bookings | +25.8% | +96.2% | -22.6% |
| Corporate Travel | +37.2% | +272.8% | -30.2% |
| Leisure Travel | +23.4% | +122.6% | -1.1% |
| Electronic Miscellaneous Document (EMD) Sales | +26.3% | +102.6% | +49.6% |
| Source: Big Data Federation, Inc. |
Domestic bookings — which typically account for about half of U.S. passenger airline revenues — grew +25.3% MoM and inched closer to pre-pandemic levels (-9.5% YoY3). International bookings rose +25.8% MoM (almost double the bookings in 3/21) bolstered by transatlantic tourism and loosening global travel restrictions. Subsequent easing in New Zealand, Australia, and many Asian and African nations is expected to build on the momentum to make up any shortfall.
Leisure travel (~40% of passenger airline revenue) improved +23.4% MoM and, as such, represents an almost complete return to pre-pandemic norms (-1% YoY3). Revival in the corporate segment remains far below 2019 levels (-30.2% YoY3) but had promising +37.2% MoM growth. Small and medium enterprises are leading the recovery of this category, likely reflecting their nimbleness compared to their larger counterparts which tend to be weighed down by rigid corporate policies.
In addition, U.S. airports have been experiencing their busiest year since the first lockdown. After hitting rock bottom in 2020, passenger traffic is up +52.5% YoY, +1106.0% YoY2, and, at the time of writing, down only -10.9% YoY3. Reflecting pre-coronavirus trends, airports with the most activity are in Florida and Texas; these had the fastest recovery and are now back to pre-pandemic volumes. Other airports, such as LAX, JFK, and ORD – all important international flight destinations and transit hubs – are still playing catch up.
With ever greater travel freedom and summer just around the corner, pent-up demand should further propel airline industry revenues to new heights (barring yet another outbreak or freak event).
1YoY3 = year-over-year compared to March 2019.
Published by Big Data Federation · All insights · Subscribe to Insights