Hotels Welcome Back Guests As Travel Demand Booms
By Big Data Federation, Inc.

Signaling an early spring start, U.S. hotel revenues registered nearly $16B in March – a level usually only seen in the peak summer season. Propelling sales were spring break travel and “bleisure”, a trend of mixing business and leisure travel as work-life boundaries blur.
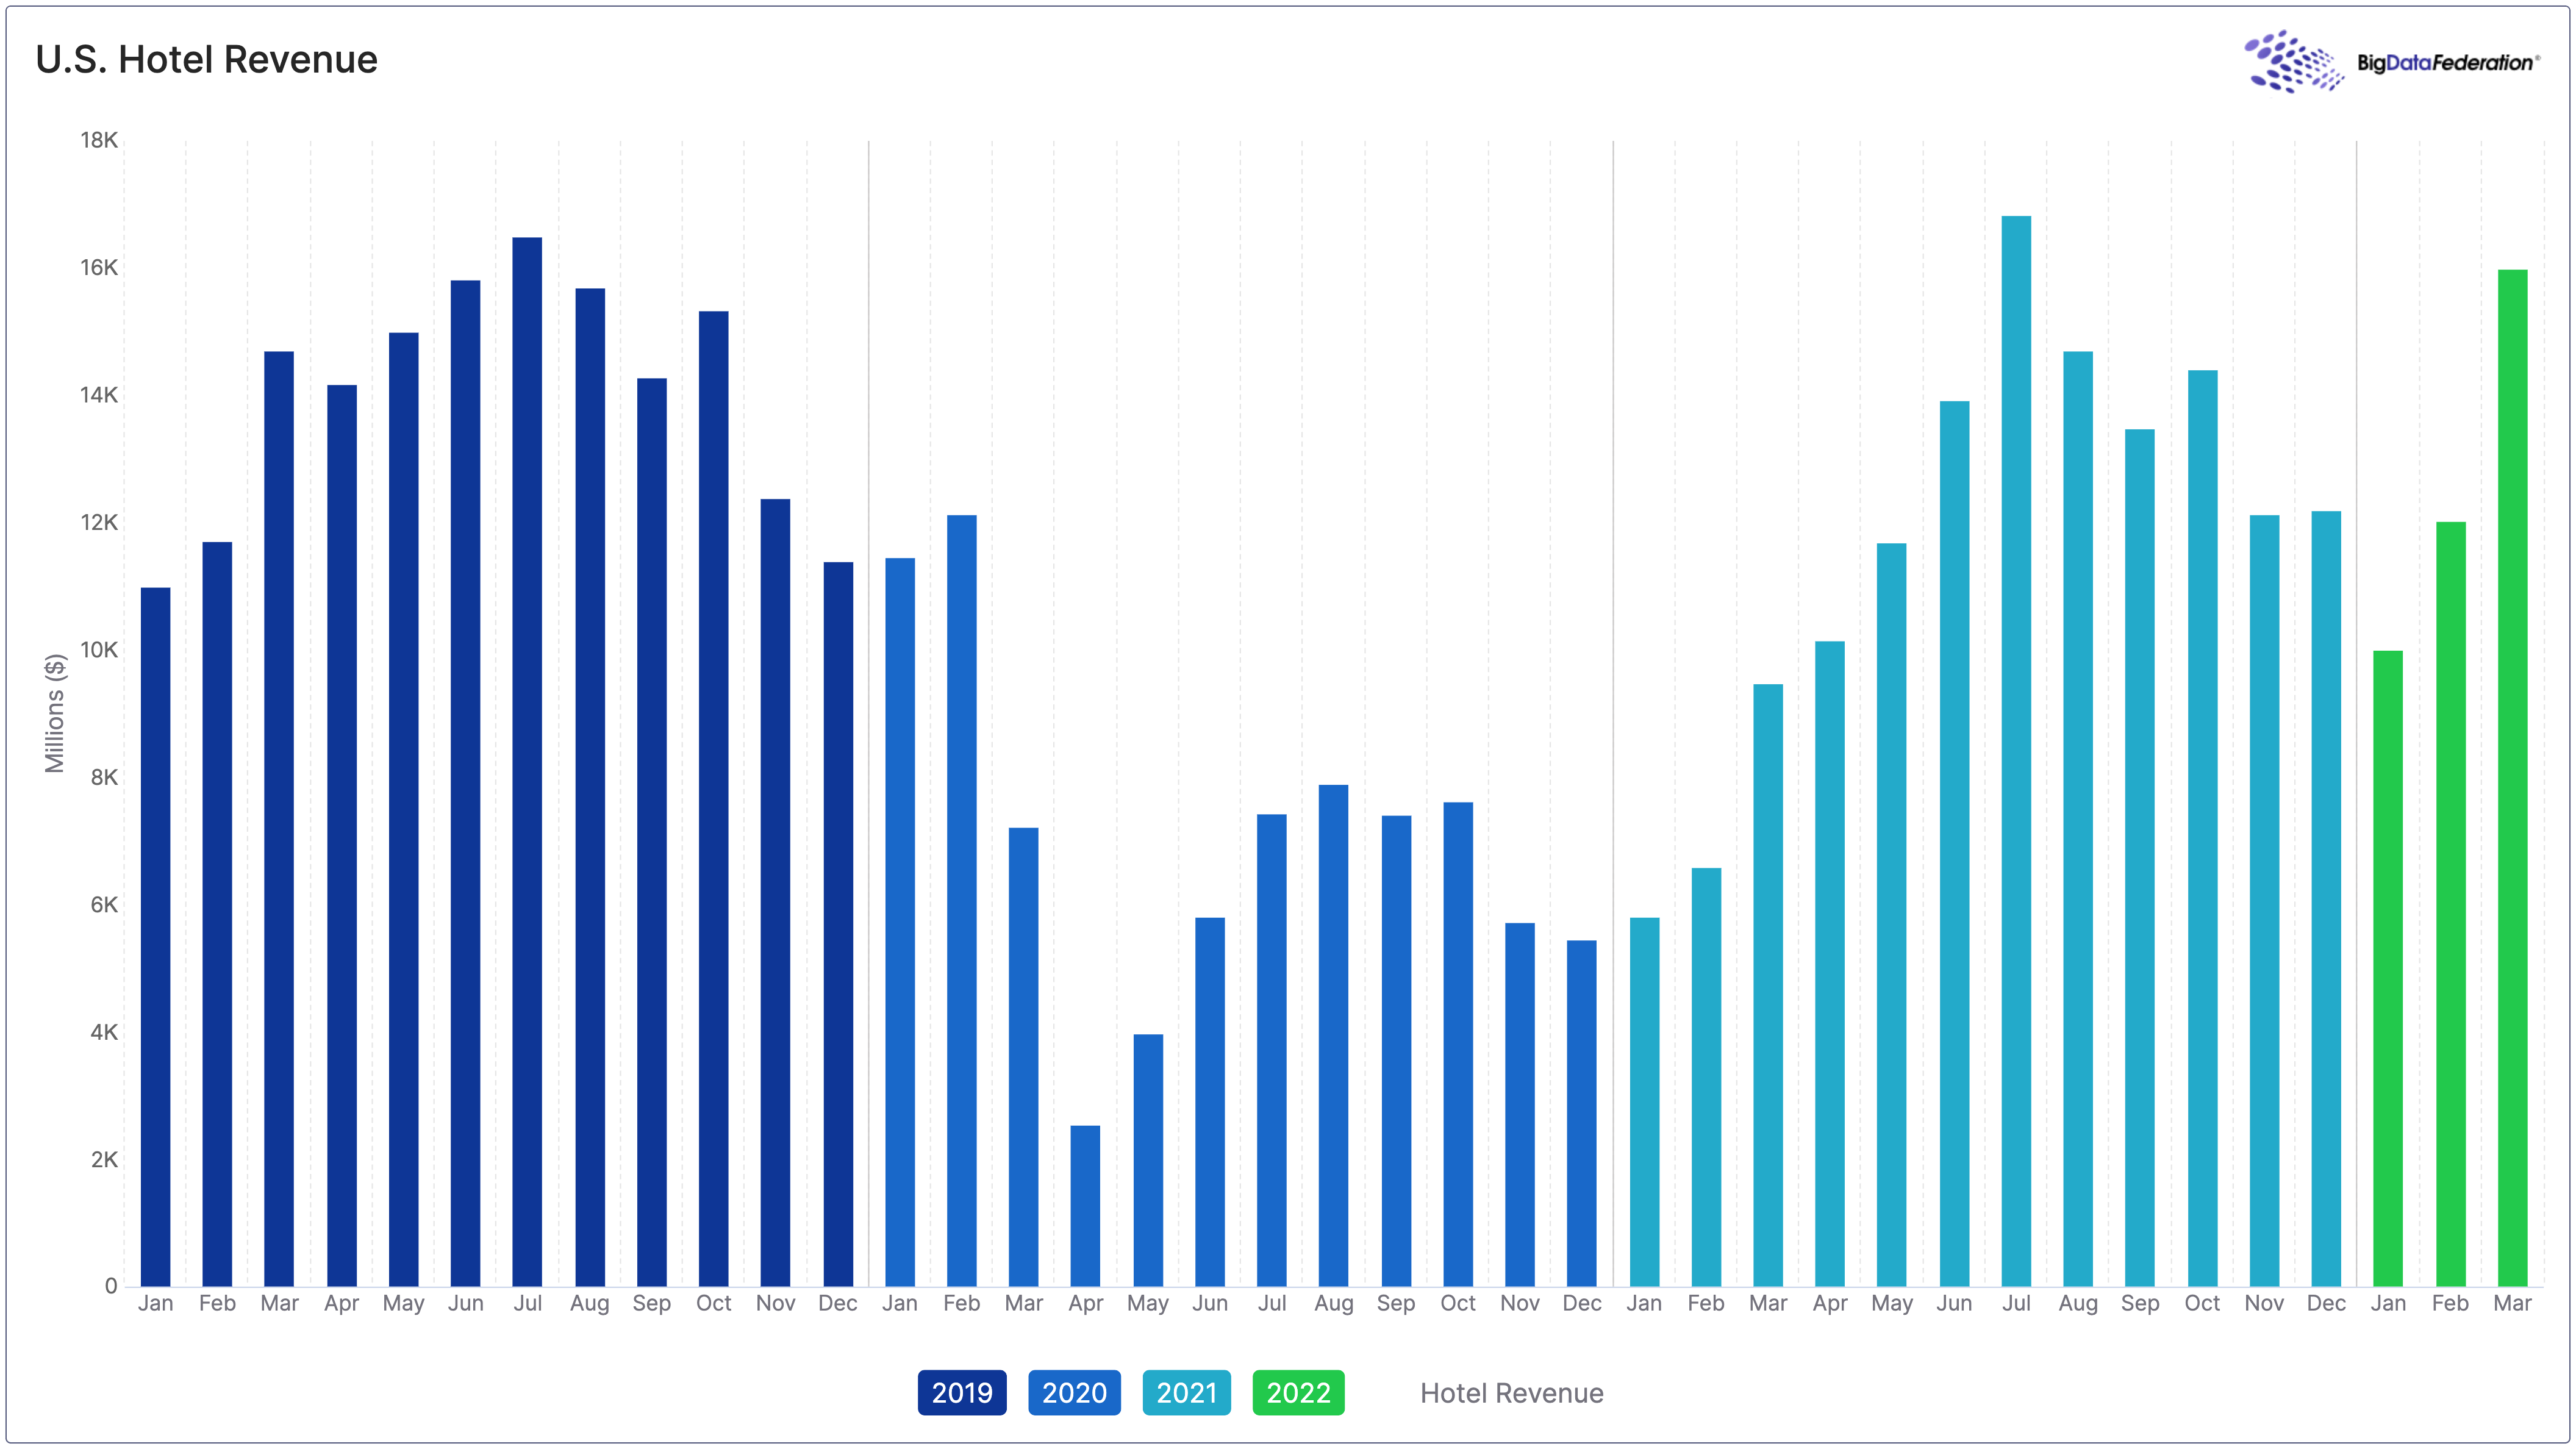
While the number of rooms sold was stable (-1.3% YoY31), supply expanded (+4.8% YoY3), causing occupancy rates2 to remain just slightly below pre-pandemic norms (-4%). Weekend occupancy (mainly leisure travelers) only fully recovered towards late March, with weekday occupancy (typically corporate travelers) also showing improvement but with room to grow.
| Data | MoM | YoY | YoY3 |
| U.S. Hotel Revenue | +32.9% | +68.6% | +8.7% |
| U.S. Revenue Per Available Room (RevPAR) | +19.8% | +62.5% | +3.7% |
| U.S. Hotel Demand (number of rooms sold) | +24.7% | +21.6% | -1.3% |
| U.S. Hotel Average Daily Rate (ADR) | +7.1% | +39.5% | +9.4% |
| U.S. Hotel Supply | +11.0% | +3.8% | +4.8% |
| U.S. Hotel Employees | -0.9% | +21.6% | -19.6% |
| Source: Big Data Federation, Inc. |
Offsetting these somewhat flat demand trends, ADR climbed a striking +9.4% causing RevPAR to increase +3.7% and total revenue to rise almost 9% compared to 2019. This is despite hotels continuing to suffer from labor shortages (-19.6%) as a consequence of COVID-19-related impacts (e.g., retraining, job security, pay, and health concerns) – a trend that can be expected to persist in the foreseeable future. On the bright side, abating pandemic-related concerns should continue to unleash pent-up demand for travel services and allow hotel revenues to maintain an upward trajectory.
1YoY3 = compared to March 2019.
2 Occupancy rate is measured by dividing the number of occupied rooms by the number of available rooms and multiplying by 100.
Published by Big Data Federation · All insights · Subscribe to Insights