Large Cap Quality Strategy
By Big Data Federation, Inc.

Quality factors are appealing to investors seeking stocks with strong financial health, typically characterized by high profitability, low debt, and consistent earnings growth, with the goal of outperforming the broader market.
In this piece, using the OdinUltra tool, we will develop a quality factor strategy for large-cap stocks using the S&P 500 Index as our stock universe. Our quality factor incorporates three key variables: return on equity, debt to equity, and earnings variability. Return on equity assesses profitability by how efficiently a company is using its equity base to generate profits. Debt to equity, a solvency ratio, measures a company’s ability to meet its debt obligations on an ongoing basis. Earnings variability, defined as the standard deviation of year-over-year earnings per share growth over the last four years, serves as a stability indicator, evaluating the consistency of a company’s earnings performance. The quality factor for each company is calculated by combining the standardized scores of the three variables, which are then ranked accordingly.
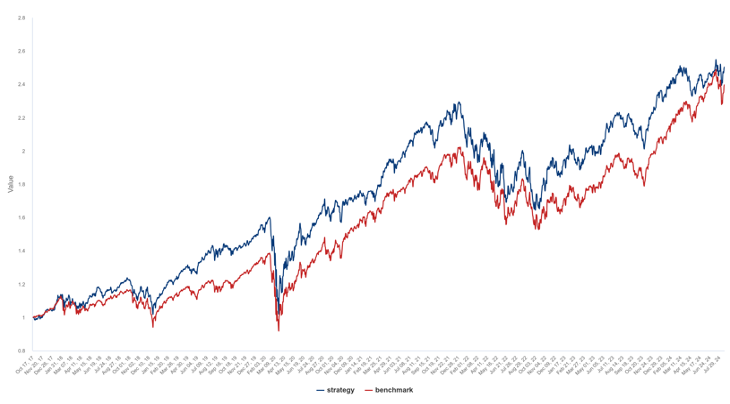
At the beginning of each quarter, we enter a long position on the top one hundred stocks from the universe of historical S&P 500 companies that exhibit the highest quality scores relative to their peers. The following chart compares the backtested portfolio, formed using market cap weights over the past seven years, with the common benchmark of the S&P 500 Total Return Index. Our quarterly quality factor strategy consistently outperforms the S&P 500 Total Return Index benchmark. Using OdinUltra, we can build and evaluate this strategy in minutes with data-driven analytics support.
As the next step, we compare the performance of our quarterly strategy above to an additional modeling frequency of monthly, as well as to the iShares MSCI USA Quality Factor ETF (QUAL). QUAL is the leading large-cap quality factor ETF, with over a decade of history and approximately $45 billion in assets under management (AUM), and it is updated semi-annually. Interestingly, our quality factor strategy with a monthly update frequency performs even better, particularly in the 2018-2019 period. Nevertheless, both our monthly and quarterly update frequency strategies have outperformed QUAL, with the former by 75 bp per annum since 2017. For further study, users can view performance metrics, download historical positions, and access NAV details on OdinUltra, if desired.
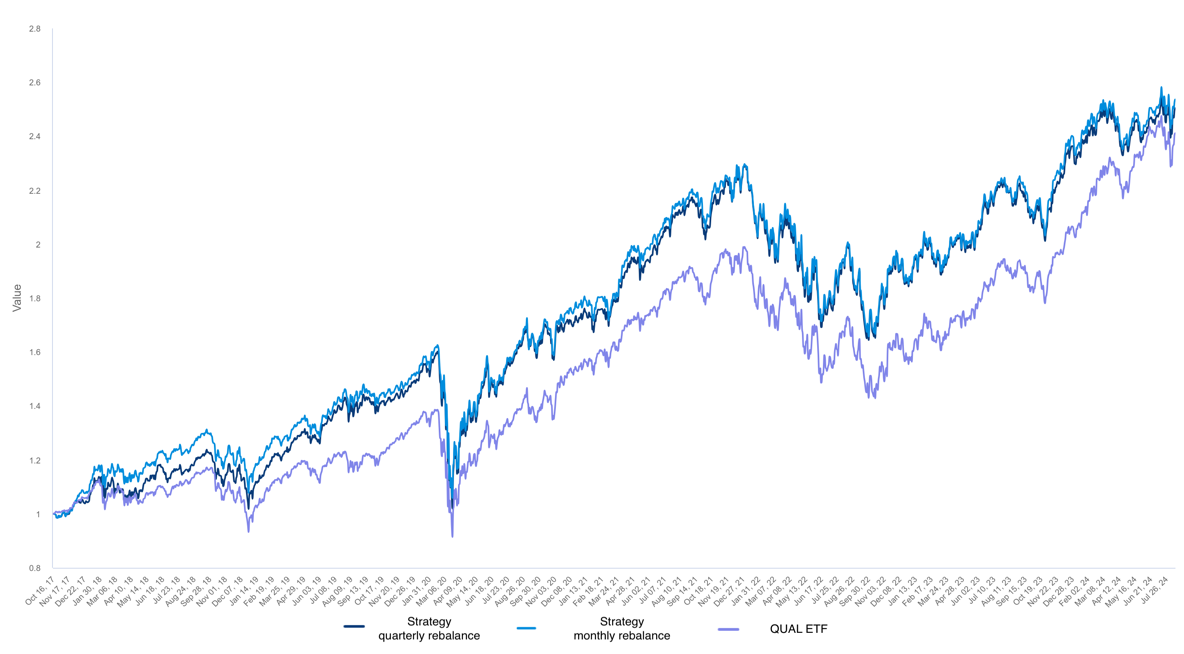
In this article, we highlighted the advantages of adopting a more active approach to a well-established quality factor strategy. By merely altering the rebalancing frequency from semi-annual to monthly and quarterly with just a few clicks and no coding, we showcased notable improvements in the strategy’s performance. No static strategy can survive throughout time; investment management must be dynamic to succeed.
To learn more, contact us at strategy@odinultra.ai.
Published by Big Data Federation · All insights · Subscribe to Insights