Nifty 50: A Deep Dive
By Big Data Federation, Inc.
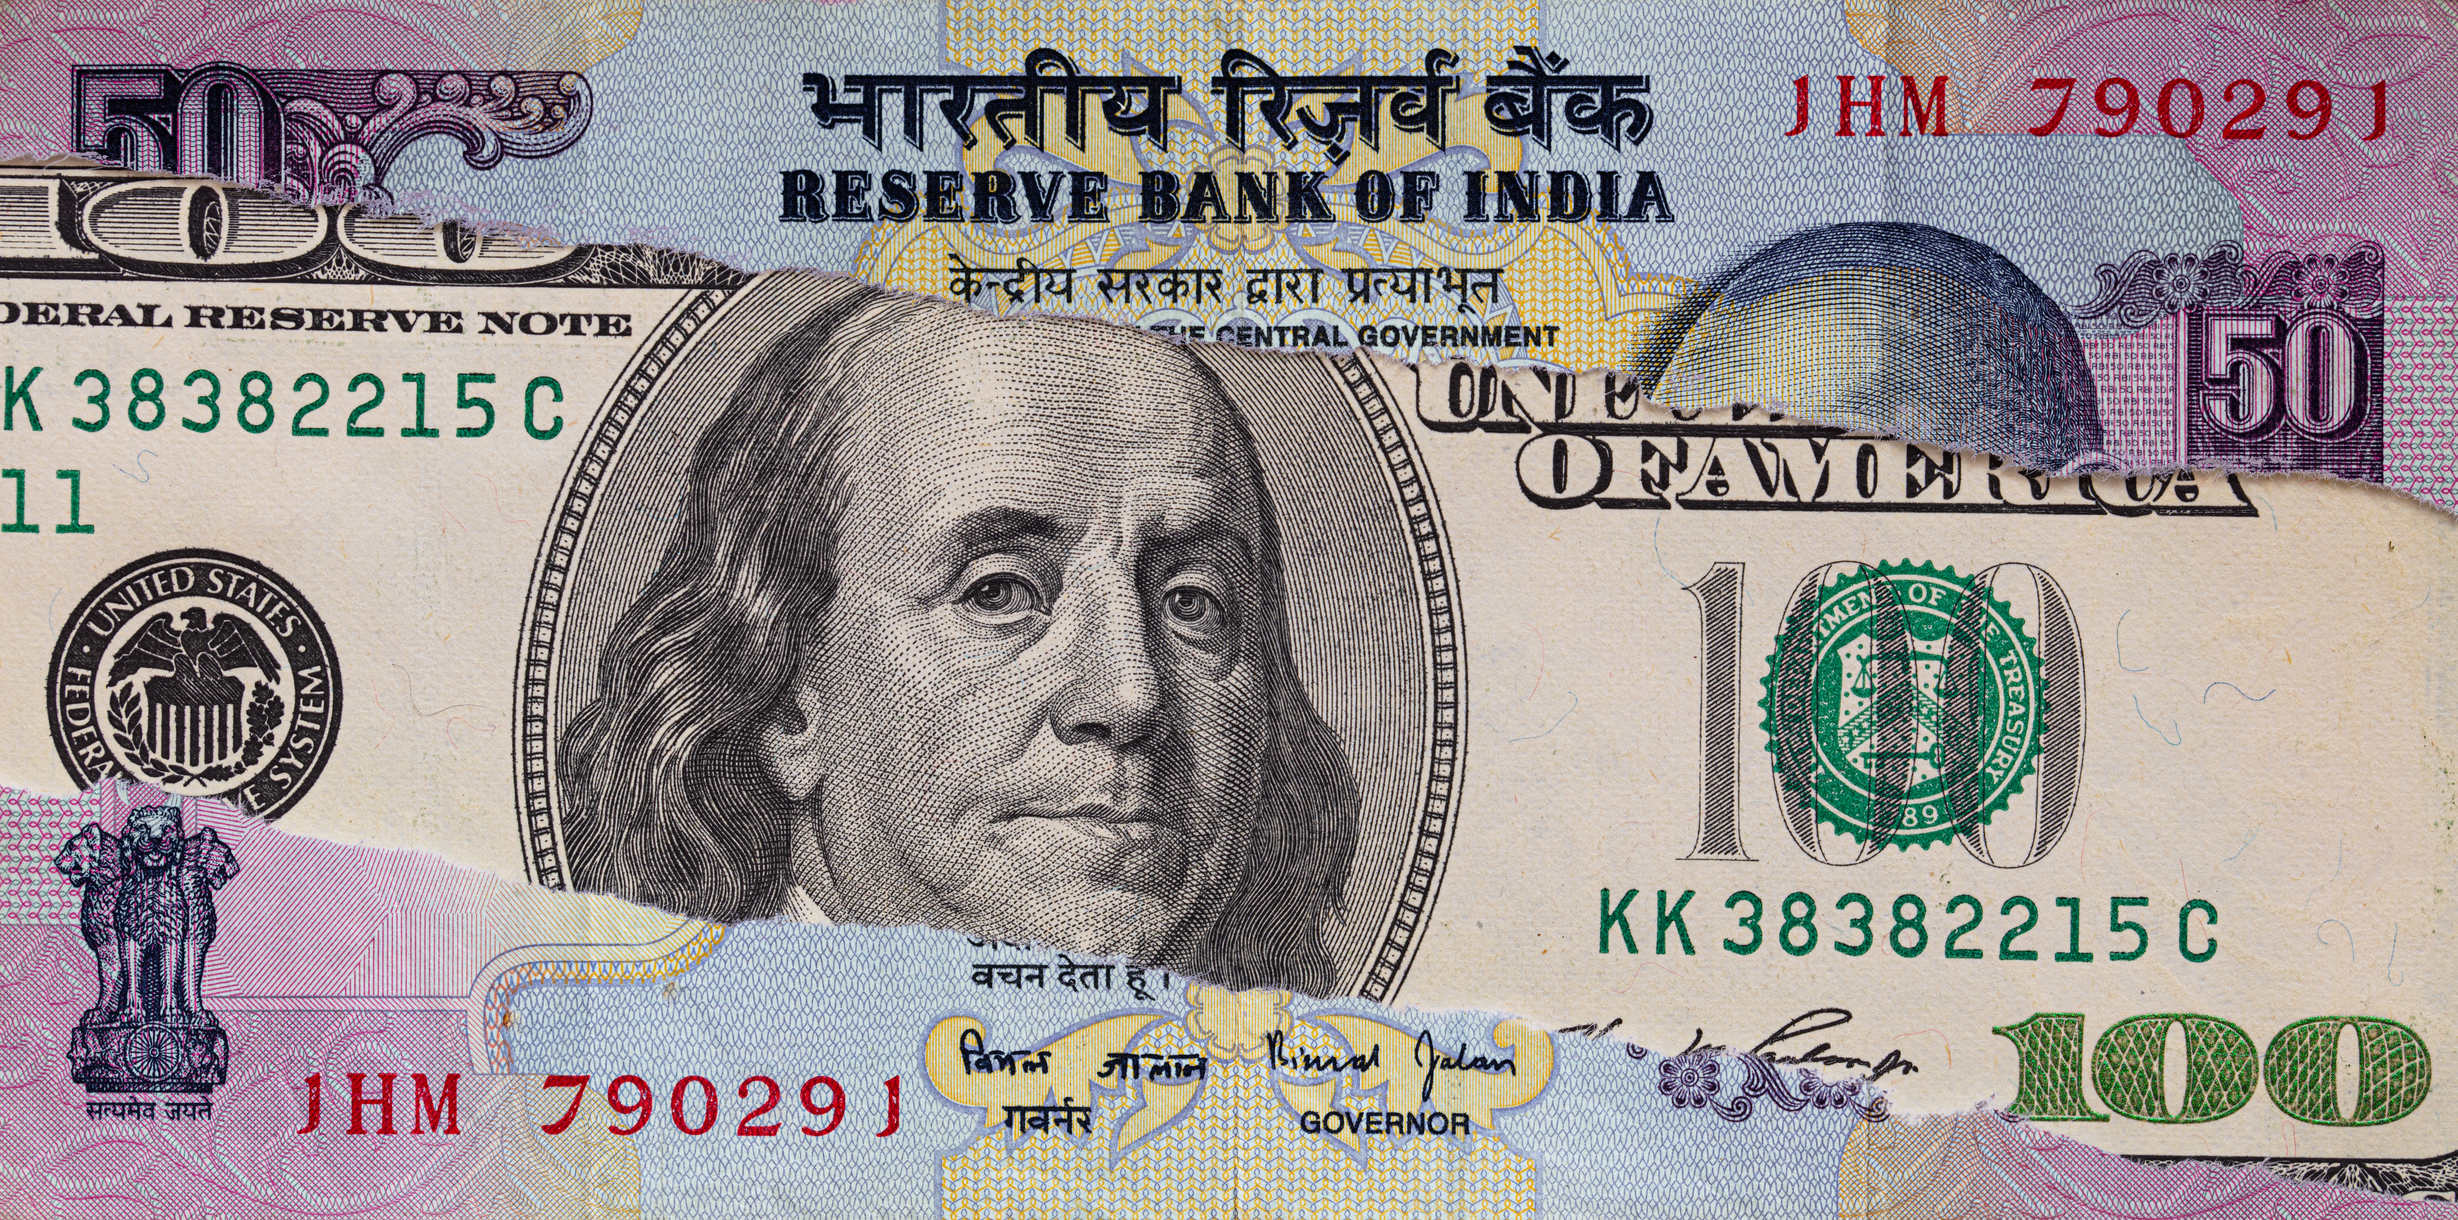
India’s Nifty 50 benchmark index reached record highs over the summer. In an unprecedented study leveraging cutting-edge technology trained for global financial analysis, we have conducted a comprehensive analysis of the Indian equity market. Let’s do this.
Price Action
The Nifty 50 and S&P 500 indices are both market capitalization-weighted and reflect performance in their respective local currencies — Nifty 50 in Indian Rupees (INR) and S&P 500 in U.S. Dollars (USD). Since local currencies significantly impact the value of equity indices, let's compare the performance excluding the currency effect.
As of August 30, 2024, for an Indian investor, the Nifty 50 index has gained 16.48% in INR, compared to the S&P 500 index’s 19.55%. Conversely, for a U.S. investor, the Nifty 50's year-to-date performance in USD stands at 12.33%, while the S&P 500 returned 19.09%.
The S&P 500 has consistently outperformed the Nifty 50, except over a five year horizon in the local currency, as seen from the table below.
| Currency | Index | YTD (%) | 5 YR (%) |
| INR | Nifty 50 | 16.48 | 128.93 |
| S&P 500 | 19.55 | 112.07 | |
| USD | Nifty 50 | 12.33 | 58.74 |
| S&P 500 | 19.09 | 93.01 |
Fundamentals
Deploying mass data aggregation of point-in-time data, we have dived further into the fundamentals of Nifty 50 companies.
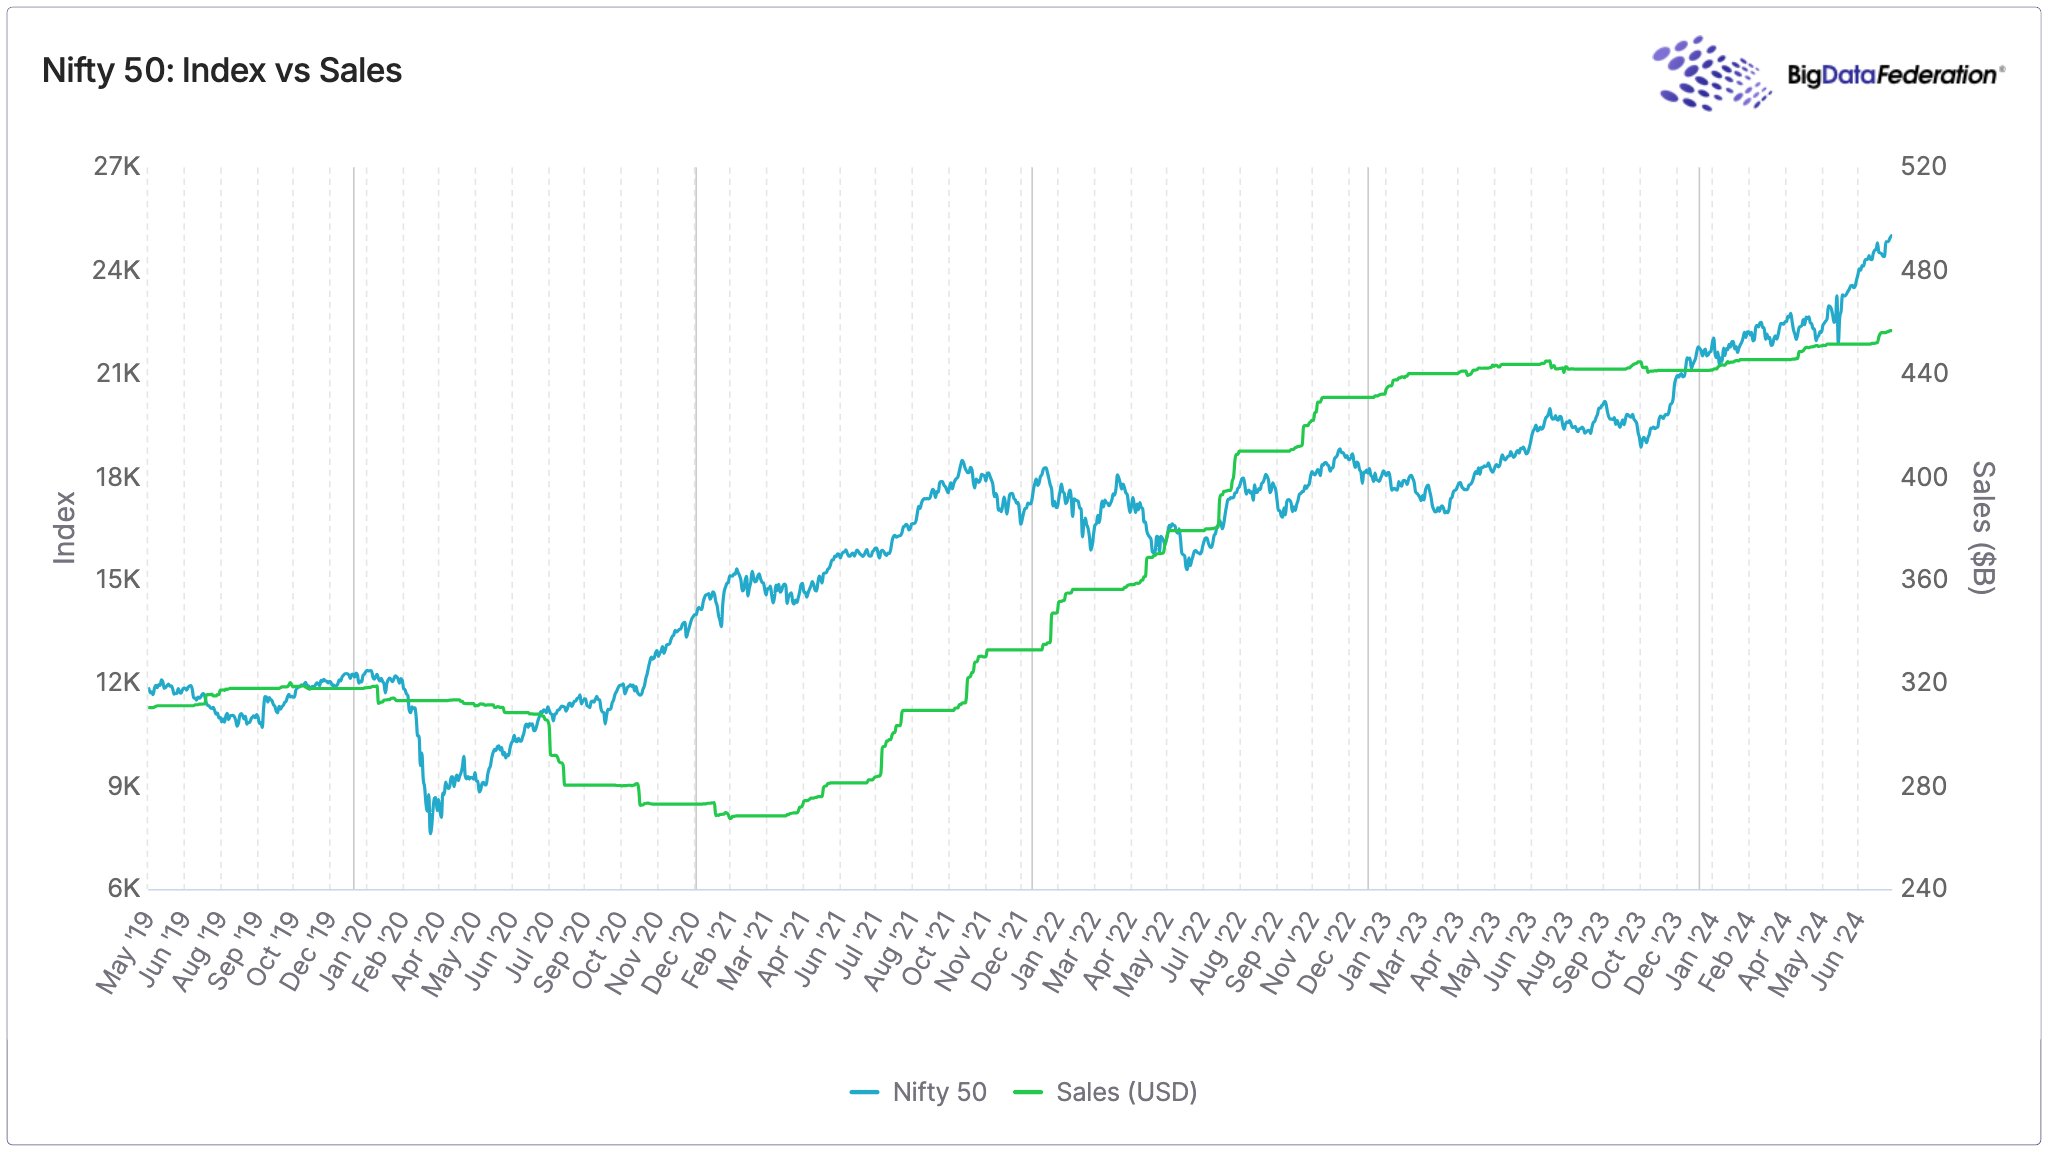
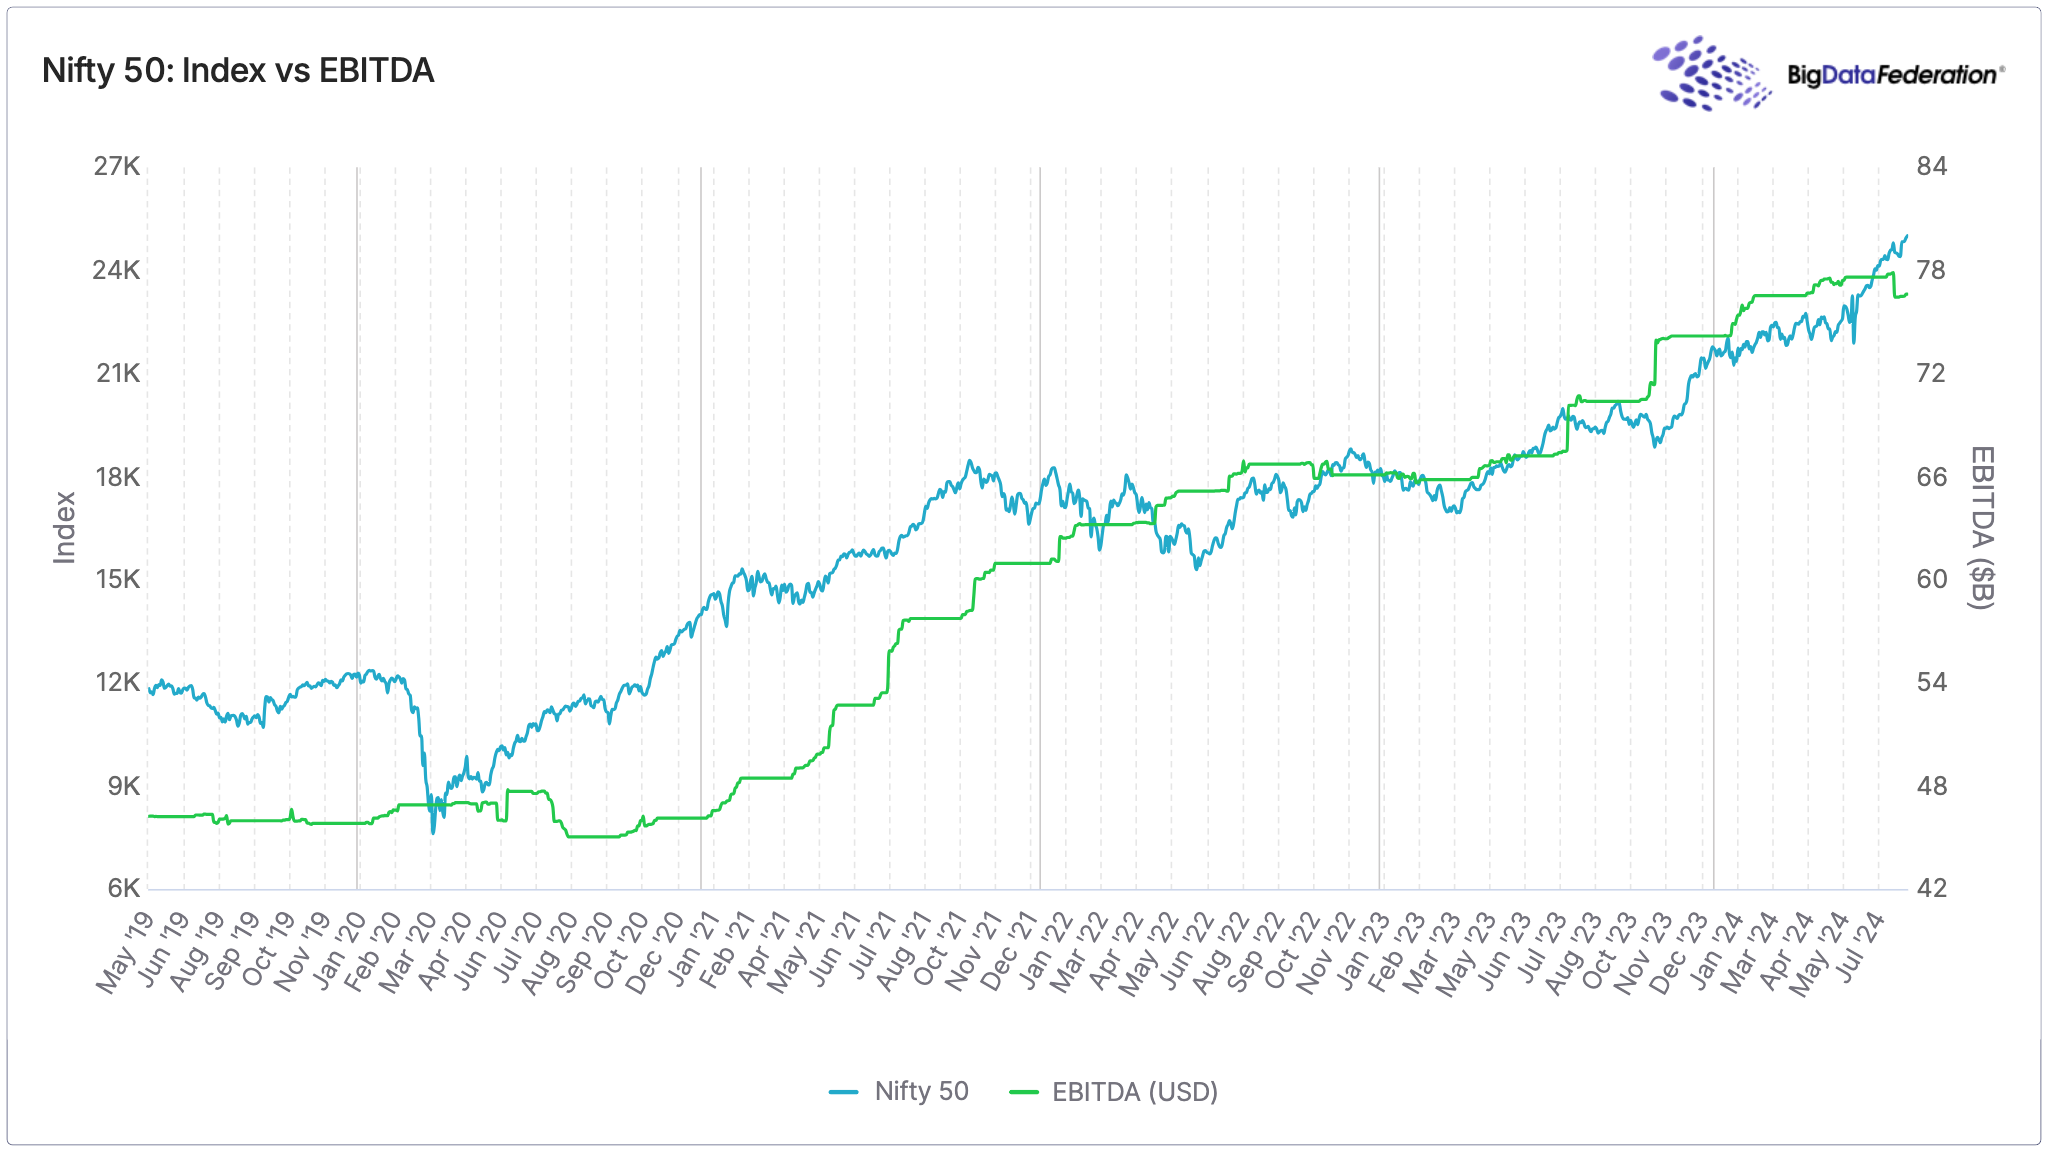
Our evaluation targets several critical financial metrics for Nifty 50 companies, such as sales, gross margin, EBITDA (earnings before interest, taxes, depreciation, and amortization), and EBITDA margin. Our fundamental aggregations are rooted in real-time earnings dates, capturing financial dynamics as they unfold, and honing in exclusively on companies with consistent reporting data. By performing our analysis in US Dollars, we eliminate local currency fluctuations effects, using a methodical approach that averages the local currency over the fiscal quarter start and end dates for accurate US Dollar comparison.
Demonstrated below are the summed sales and EBITDA of Nifty 50 companies. Importantly, our method does not consider survivorship bias, which could present Nifty 50 fundamentals in an even more favorable light. Given this optimistic portrayal, the underlying fundamental growth is robust. When employing EBITDA — a metric designed to address challenges with net profitability and often benefits companies’ management — the trend remains positive.
Valuations
Valuation is complicated and requires careful attention to the methodology employed. A common error among market participants is to average the valuation metrics of index components. Instead, we treat the Nifty 50 as a single company by summing all the sales, EBITDA, and market cap of its constituents, without weighting by market cap, thereby avoiding the distortions caused by averaging methods, which overlook the size of the underlying fundamentals. Our figure below demonstrates the total valuation for price-to-sales and price-to-EBITDA ratios.
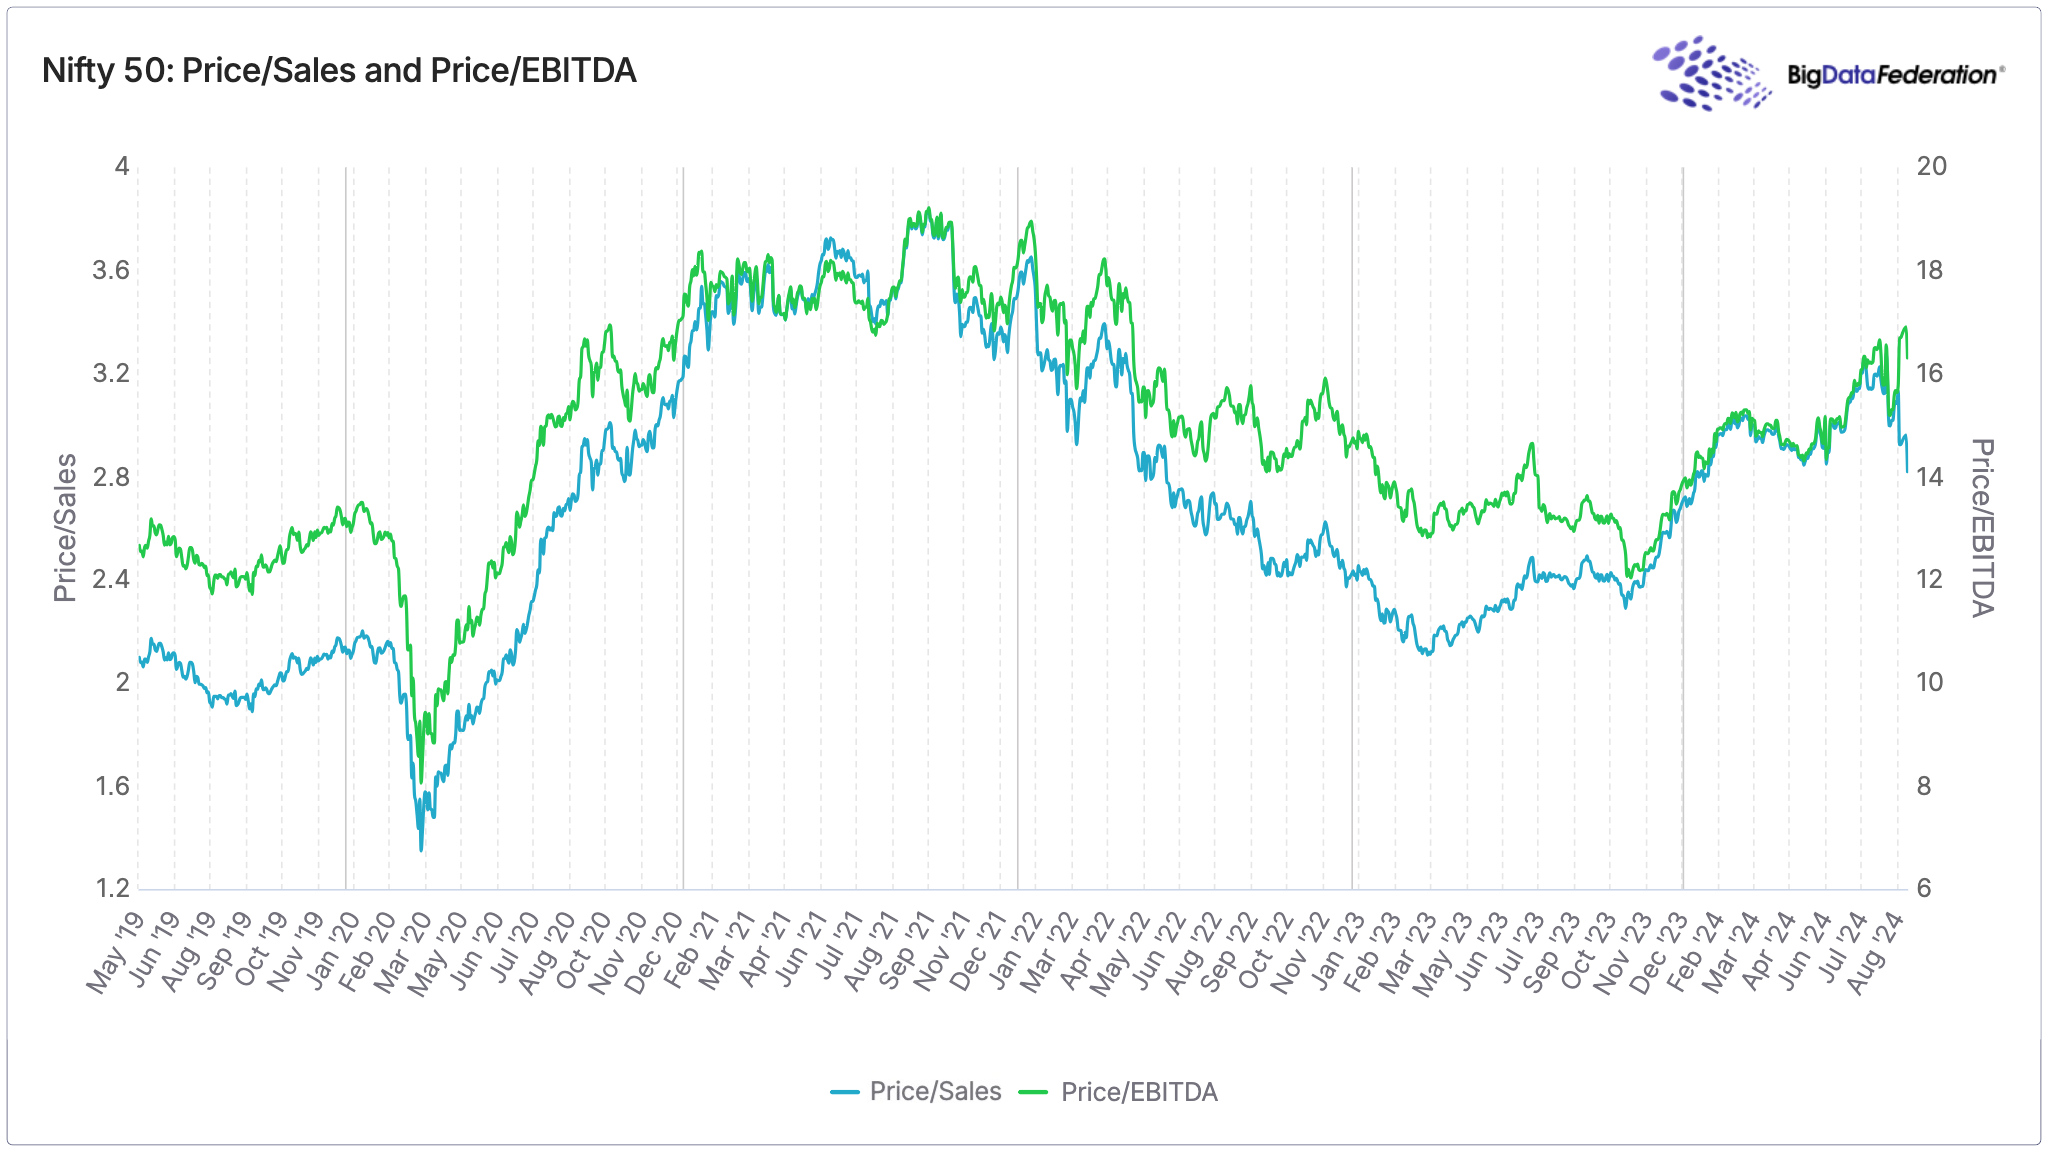
Nifty 50's valuation metrics, as measured by Price to Sales and Price to EBITDA ratios, have generally been above than those of the S&P 500 over the past five years. While it may appear that Nifty 50 is expensive compared to the S&P 500, the higher premium could indicate positive sentiment or stronger growth expectations for Nifty 50 companies.
Conclusion
As global investors increasingly look beyond China, Japan is not the only place that has benefited; India stands out as a prime beneficiary. India’s advantages are clear: companies diversifying supply chains are increasingly turning to it. Also, as the world’s most populous country, India enjoys the demographic tailwinds of a young, educated workforce and has recently surpassed the $2,500 per capita income mark, fueling a surge in demand for cars and services. While some argue that India is the most expensive emerging market, others believe its current growth trajectory justifies a premium valuation.
Published by Big Data Federation · All insights · Subscribe to Insights