EBITDA Growth with Trend Confirmation
By Big Data Federation, Inc.

Last time, we explored a systematic S&P 500 strategy that ranked companies by year-over-year revenue growth, selected the top 10 trading above their 200-day moving average, equally weighted the portfolio, and rebalanced quarterly.
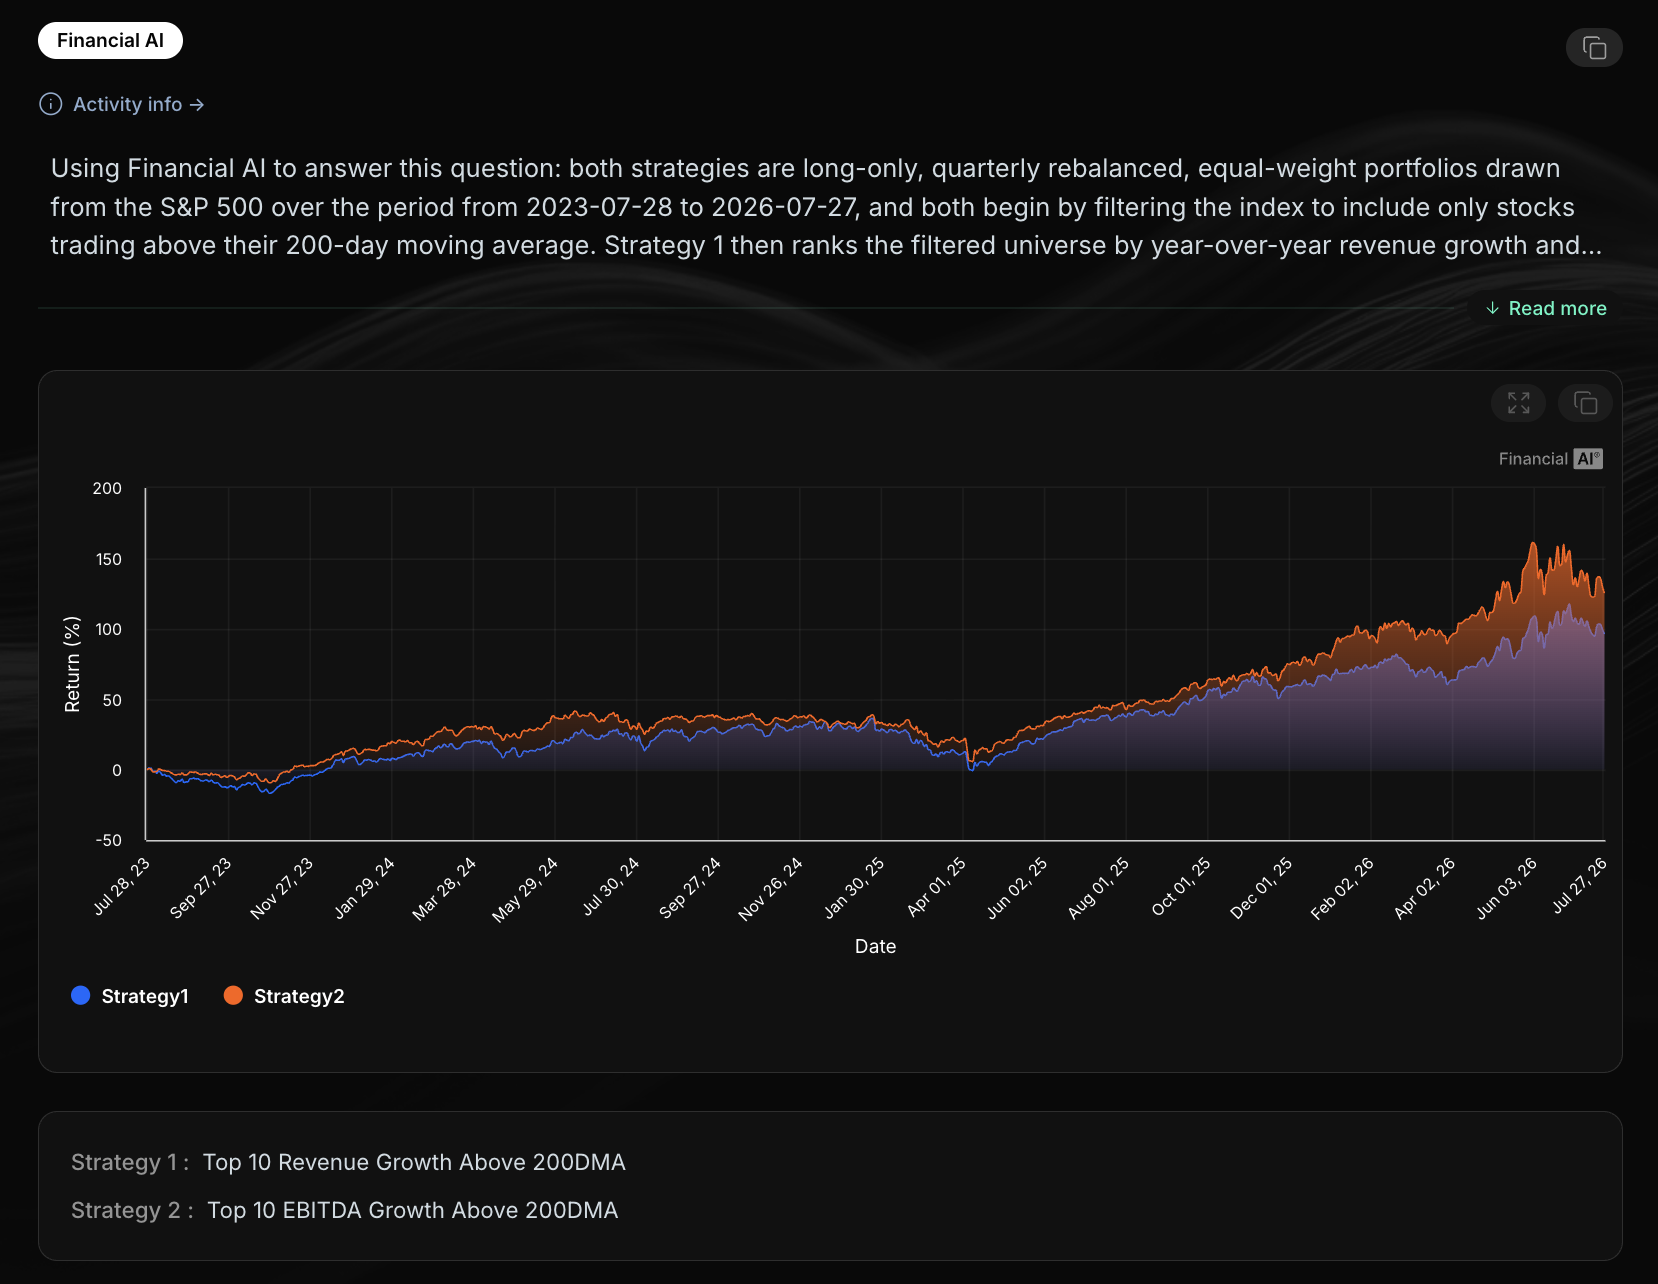
Here, we ask whether operating profitability is an even stronger signal than top-line growth. To answer that, we replace year-over-year revenue growth with year-over-year earnings before interest, tax, depreciation, and amortization (EBITDA) growth while keeping every other aspect of the strategy unchanged. Each quarter, we rank all S&P 500 constituents by EBITDA growth, retain only those trading above their own 200-day moving average, select the top 10, equally weight the portfolio, and hold it until the next quarterly rebalance. By keeping the universe, technical filter, and rebalancing schedule constant, we can isolate the impact of using EBITDA growth. The results below compare both strategies.
 |
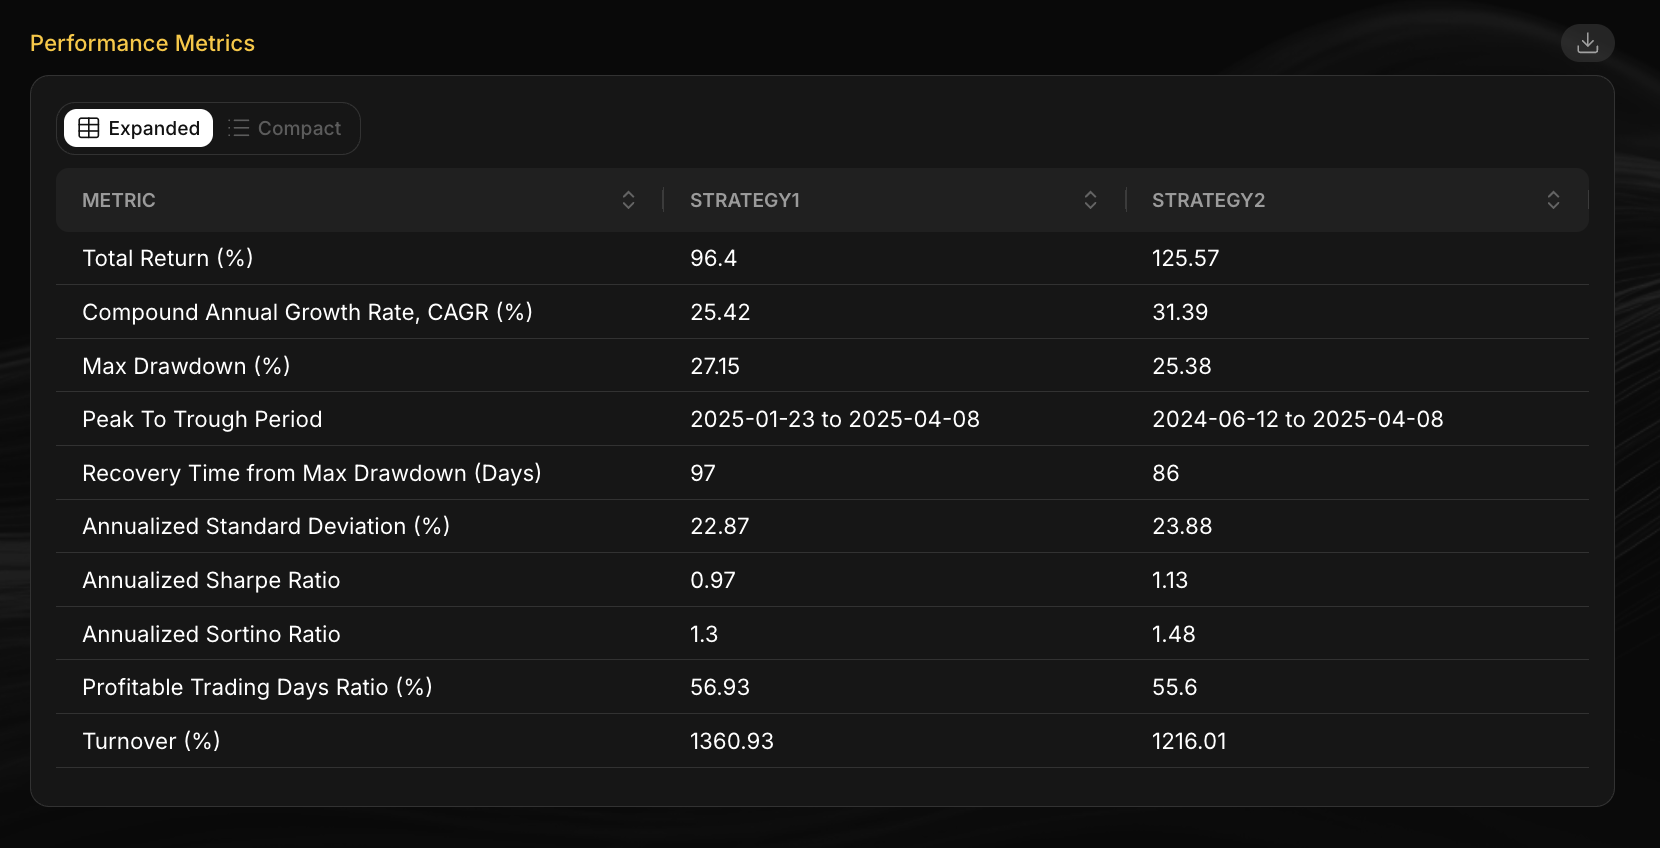 |
Switching the fundamental ranking factor from revenue growth to EBITDA growth enhanced the strategy across most key performance metrics. CAGR increased from 25.4% to 31.4%, the Sharpe ratio rose from 0.97 to 1.13, and maximum drawdown improved from 27.2% to 25.4%.
Financial AI® enables investors to build, test, and refine investment strategies in minutes through a no-code interface. Users can seamlessly combine fundamental, technical, macroeconomic, and proprietary forecasts as indicators to generate institutional-grade backtests and analyze performance across return, risk, and risk-adjusted metrics. By accelerating the entire research workflow—from idea generation and strategy construction to validation and deployment—Financial AI® empowers investors to rapidly explore, refine, and implement systematic investment strategies.
To gain access, please contact us at sales@thefinancial.ai.
Published by Big Data Federation · All insights · Subscribe to Insights