Revenue Growth with Trend Confirmation
By Big Data Federation, Inc.

No single force drives markets forever. As inflation, interest rates, trade dynamics, and technological innovation reshape the investment landscape, investors must continuously adapt their strategies. Yet even in challenging environments, pockets of exceptional growth continue to emerge, and identifying winning stocks requires more than broad market exposure.
Here, we build a systematic investment strategy that starts with a simple fundamental factor before incorporating a technical indicator. We begin with the S&P 500—a basket of the largest, most liquid, and highest-quality U.S. companies—providing an ideal universe for identifying the strongest opportunities. Our first factor is year-over-year revenue growth, often an early indicator of increasing demand, market share gains, and improving business fundamentals.
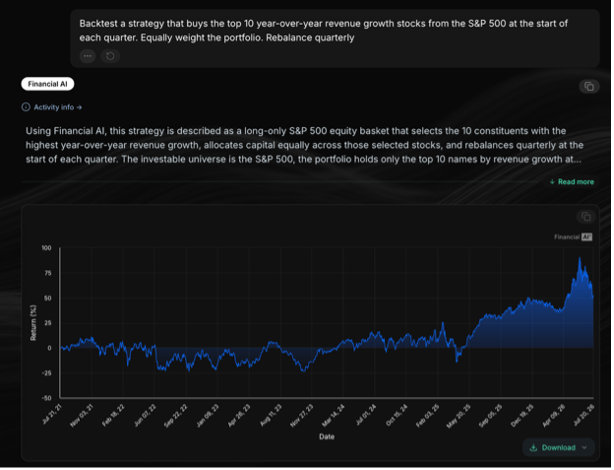
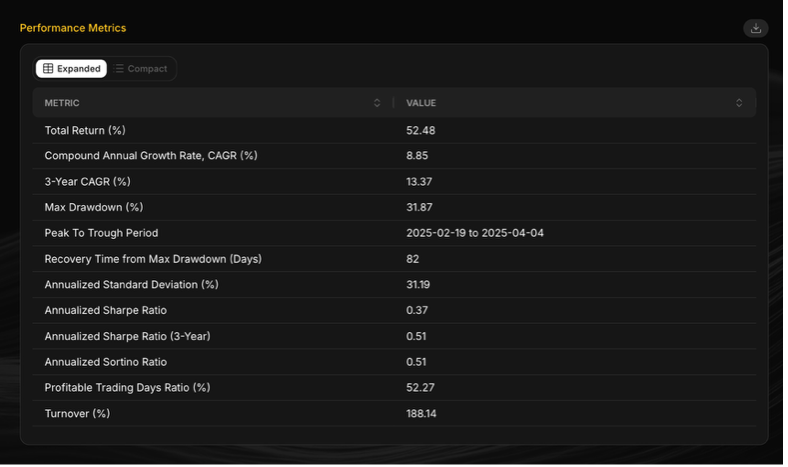
At the start of each quarter, we rank all S&P 500 constituents by year-over-year revenue growth, select the top 10, construct an equal-weighted portfolio, and hold it until the next quarterly rebalance. The strategy’s performance is shown below for the past five years.
 |
 |
For the second step, we refine the strategy by adding a technical trend filter, requiring each stock to trade above its own 200-day moving average. While year-over-year revenue growth is used to rank companies cross-sectionally and select the top 10 each quarter, the 200-day moving average is a time-series condition applied to each stock's own price history. Strong revenue growth alone does not guarantee strong stock performance, as fundamentally attractive companies can remain in prolonged downtrends. By requiring the stock price to be above its long-term trend, we seek to confirm that the market has rewarded them with sustained price strength.
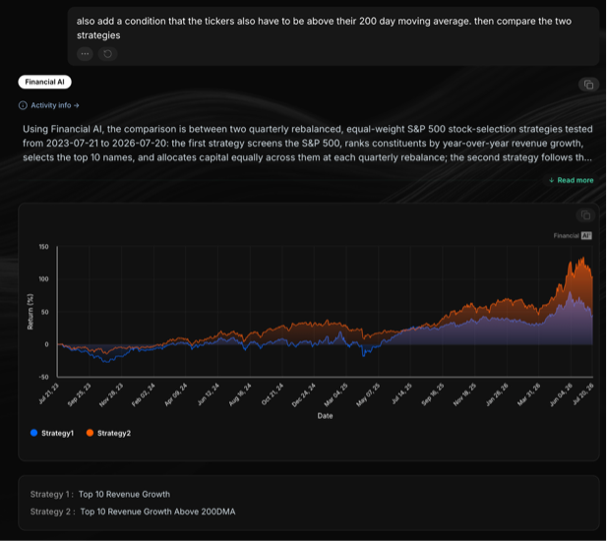
At the start of each quarter, we rank all S&P 500 constituents by year-over-year revenue growth, retain only the top 10 companies that also satisfy this trend condition, construct an equal-weighted portfolio, and hold it until the next quarterly rebalance. The results below compare the original strategy with the enhanced strategy over a shorter, three-year period.
 |
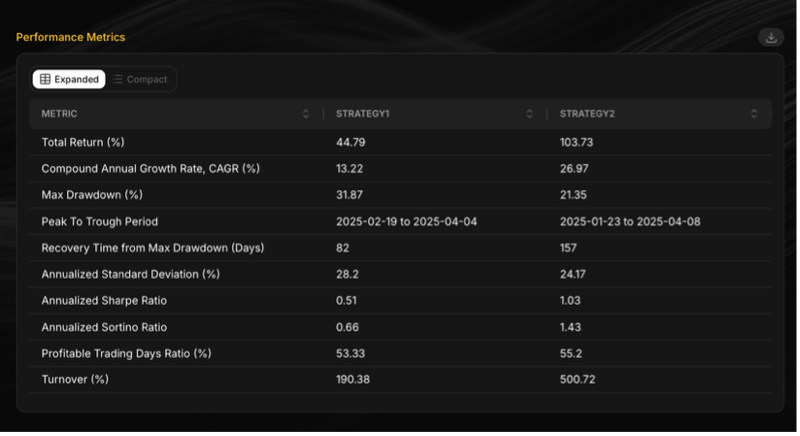 |
Adding the 200-day moving average filter materially improved the strategy across both return and risk metrics. While the original strategy generated a 44.8% total return and 13.2% CAGR, requiring stocks to also trade above their own 200-day moving average increased the total return to 103.7% and CAGR to 27.0%. The enhanced strategy also reduced maximum drawdown from 31.9% to 21.4%, lowered annualized volatility from 28.2% to 24.2%, and nearly doubled the Sharpe ratio from 0.51 to 1.03.
Financial AI® enables investors to build, test, and refine investment strategies in minutes through a no-code interface. Users can seamlessly combine fundamental, technical, macroeconomic, and proprietary forecasts as indicators to generate institutional-grade backtests and analyze performance across return, risk, and risk-adjusted metrics. By accelerating the entire research workflow—from idea generation and strategy construction to validation and deployment—Financial AI® empowers investors to rapidly explore, refine, and implement systematic investment strategies.
To gain access, please contact us at sales@thefinancial.ai.
Published by Big Data Federation · All insights · Subscribe to Insights