Air Cargo Capacity Ascents
By Big Data Federation, Inc.

- Demand held steady in the seasonally slowest month but fell year-over-year due to the economic environment
- Supply grew as passenger airlines with capacity for belly cargo reinstated services in response to strong travel demand
- Global air cargo rates mirrored trends in other transportation modes
Industry-wide demand, measured by cargo tonne kilometers (CTKs), held steady during what is typically considered the slowest month of the year and even climbed above pre-pandemic levels (0% MoM/ 3% YoY4). While it dropped on year-over-year comparisons (-8% YoY), it is a marked improvement compared to the start of the year, at half the rate of the annual decline. Headwinds included the current economic environment with elevated inflation, higher interest rates, slowing manufacturing activity, and a pullback in consumer spending. Additionally, international goods trade and air cargo demand are heavily interlinked, and the former is a key determinant of the latter. Global traders returned to the seas as ocean freight rates and delivery times normalized.
|
Data (February) |
MoM |
YoY |
YoY4 |
|
Cargo Tonne Kilometers (CTK) |
0% |
-8% |
3% |
|
Available Cargo Tonne Km (CFTK) |
-3% |
9% |
1% |
|
Cargo Load Factor (%) |
+ 1.1 pp |
-7.9 pp |
+ 0.7 pp |
|
Global Air Cargo Rates |
-5% |
-24% |
N/A |
Source: Big Data Federation, Inc.
Industry-wide capacity, measured in available cargo tonne kilometers (ACTKs), fell in line with seasonal patterns (-3% MoM). However, it soared compared to the same month last year and pre-pandemic norms (9% YoY/ 1% YoY4). Supply increased because passenger airlines continued to reinstate services after the pandemic in response to the strong recovery in travel. Every additional passenger aircraft deployed contained extra space in the lower belly to accommodate cargo. Notably, passenger carriers are more responsible for the rise in capacity, while some cargo carriers have temporarily parked jets and dialed back flight activity due to weakened demand.
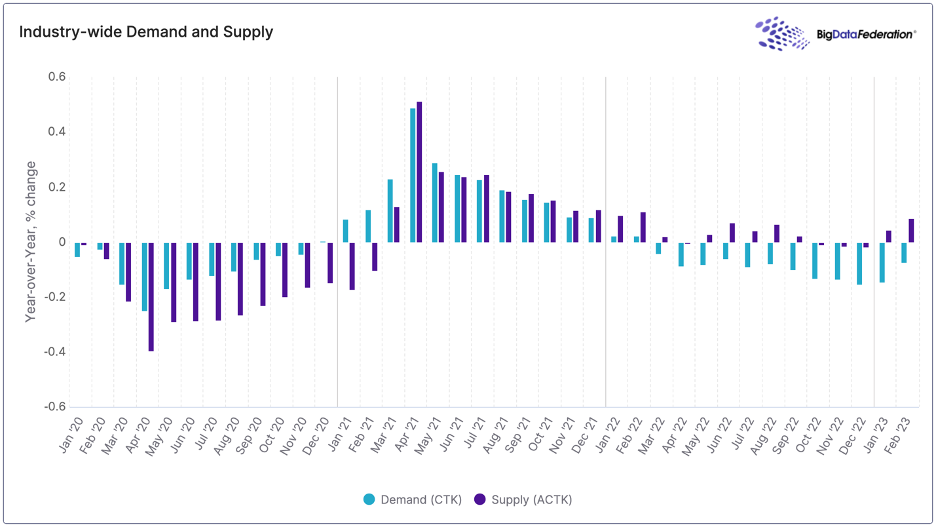
Industry-wide cargo load factor, a performance indicator that calculates the percentage of available cargo capacity loaded with goods, reflected supply outpacing demand (-7.9 pp YoY). As such, global air cargo rates – measured via real-time prices and weighted based on volumes – decreased (-5% MoM/ -24% YoY) and could sink further as passenger airlines add flights for the busy summer schedule while demand lags. Freight executives are closely watching manufacturing activity and retail inventories in hopes of a second half rebound in international orders.
1YoY4 = comparison with February 2019
Published by Big Data Federation · All insights · Subscribe to Insights