AI-Assisted Strategies to Beat the Market
By Big Data Federation, Inc.

Macroeconomic conditions in the US currently face several key issues, including geopolitical competition, relatively high inflation, and a significant supply of government debt that can drive long-term rates higher. At the same time, there are usually pockets of profitable growth at the micro level in the worst market, as exemplified by the impressive growth of AI right now.
Active strategies can help investors identify and capitalize on potential winners while avoiding potential significant market drawdowns. Using OdinUltra, the no-code specialized financial AI platform, investors can swiftly explore strategies. In this piece, we build from a single-factor strategy to a more comprehensive multi-factor strategy. We explore a combination of fundamental variables, such as revenue growth and earnings before interest, taxes, depreciation, and amortization (EBITDA) growth, along with a technical variable that stipulates the stock price be above its 200-day simple moving average (SMA).
We present three basic quantamental strategies using the S&P 500 equity basket:
-
Based on year-over-year revenue growth
-
Based on year-over-year revenue growth and stock price above 200-day SMA
-
Based on year-over-year revenue growth, stock price above 200-day SMA, and year-over-year EBITDA growth
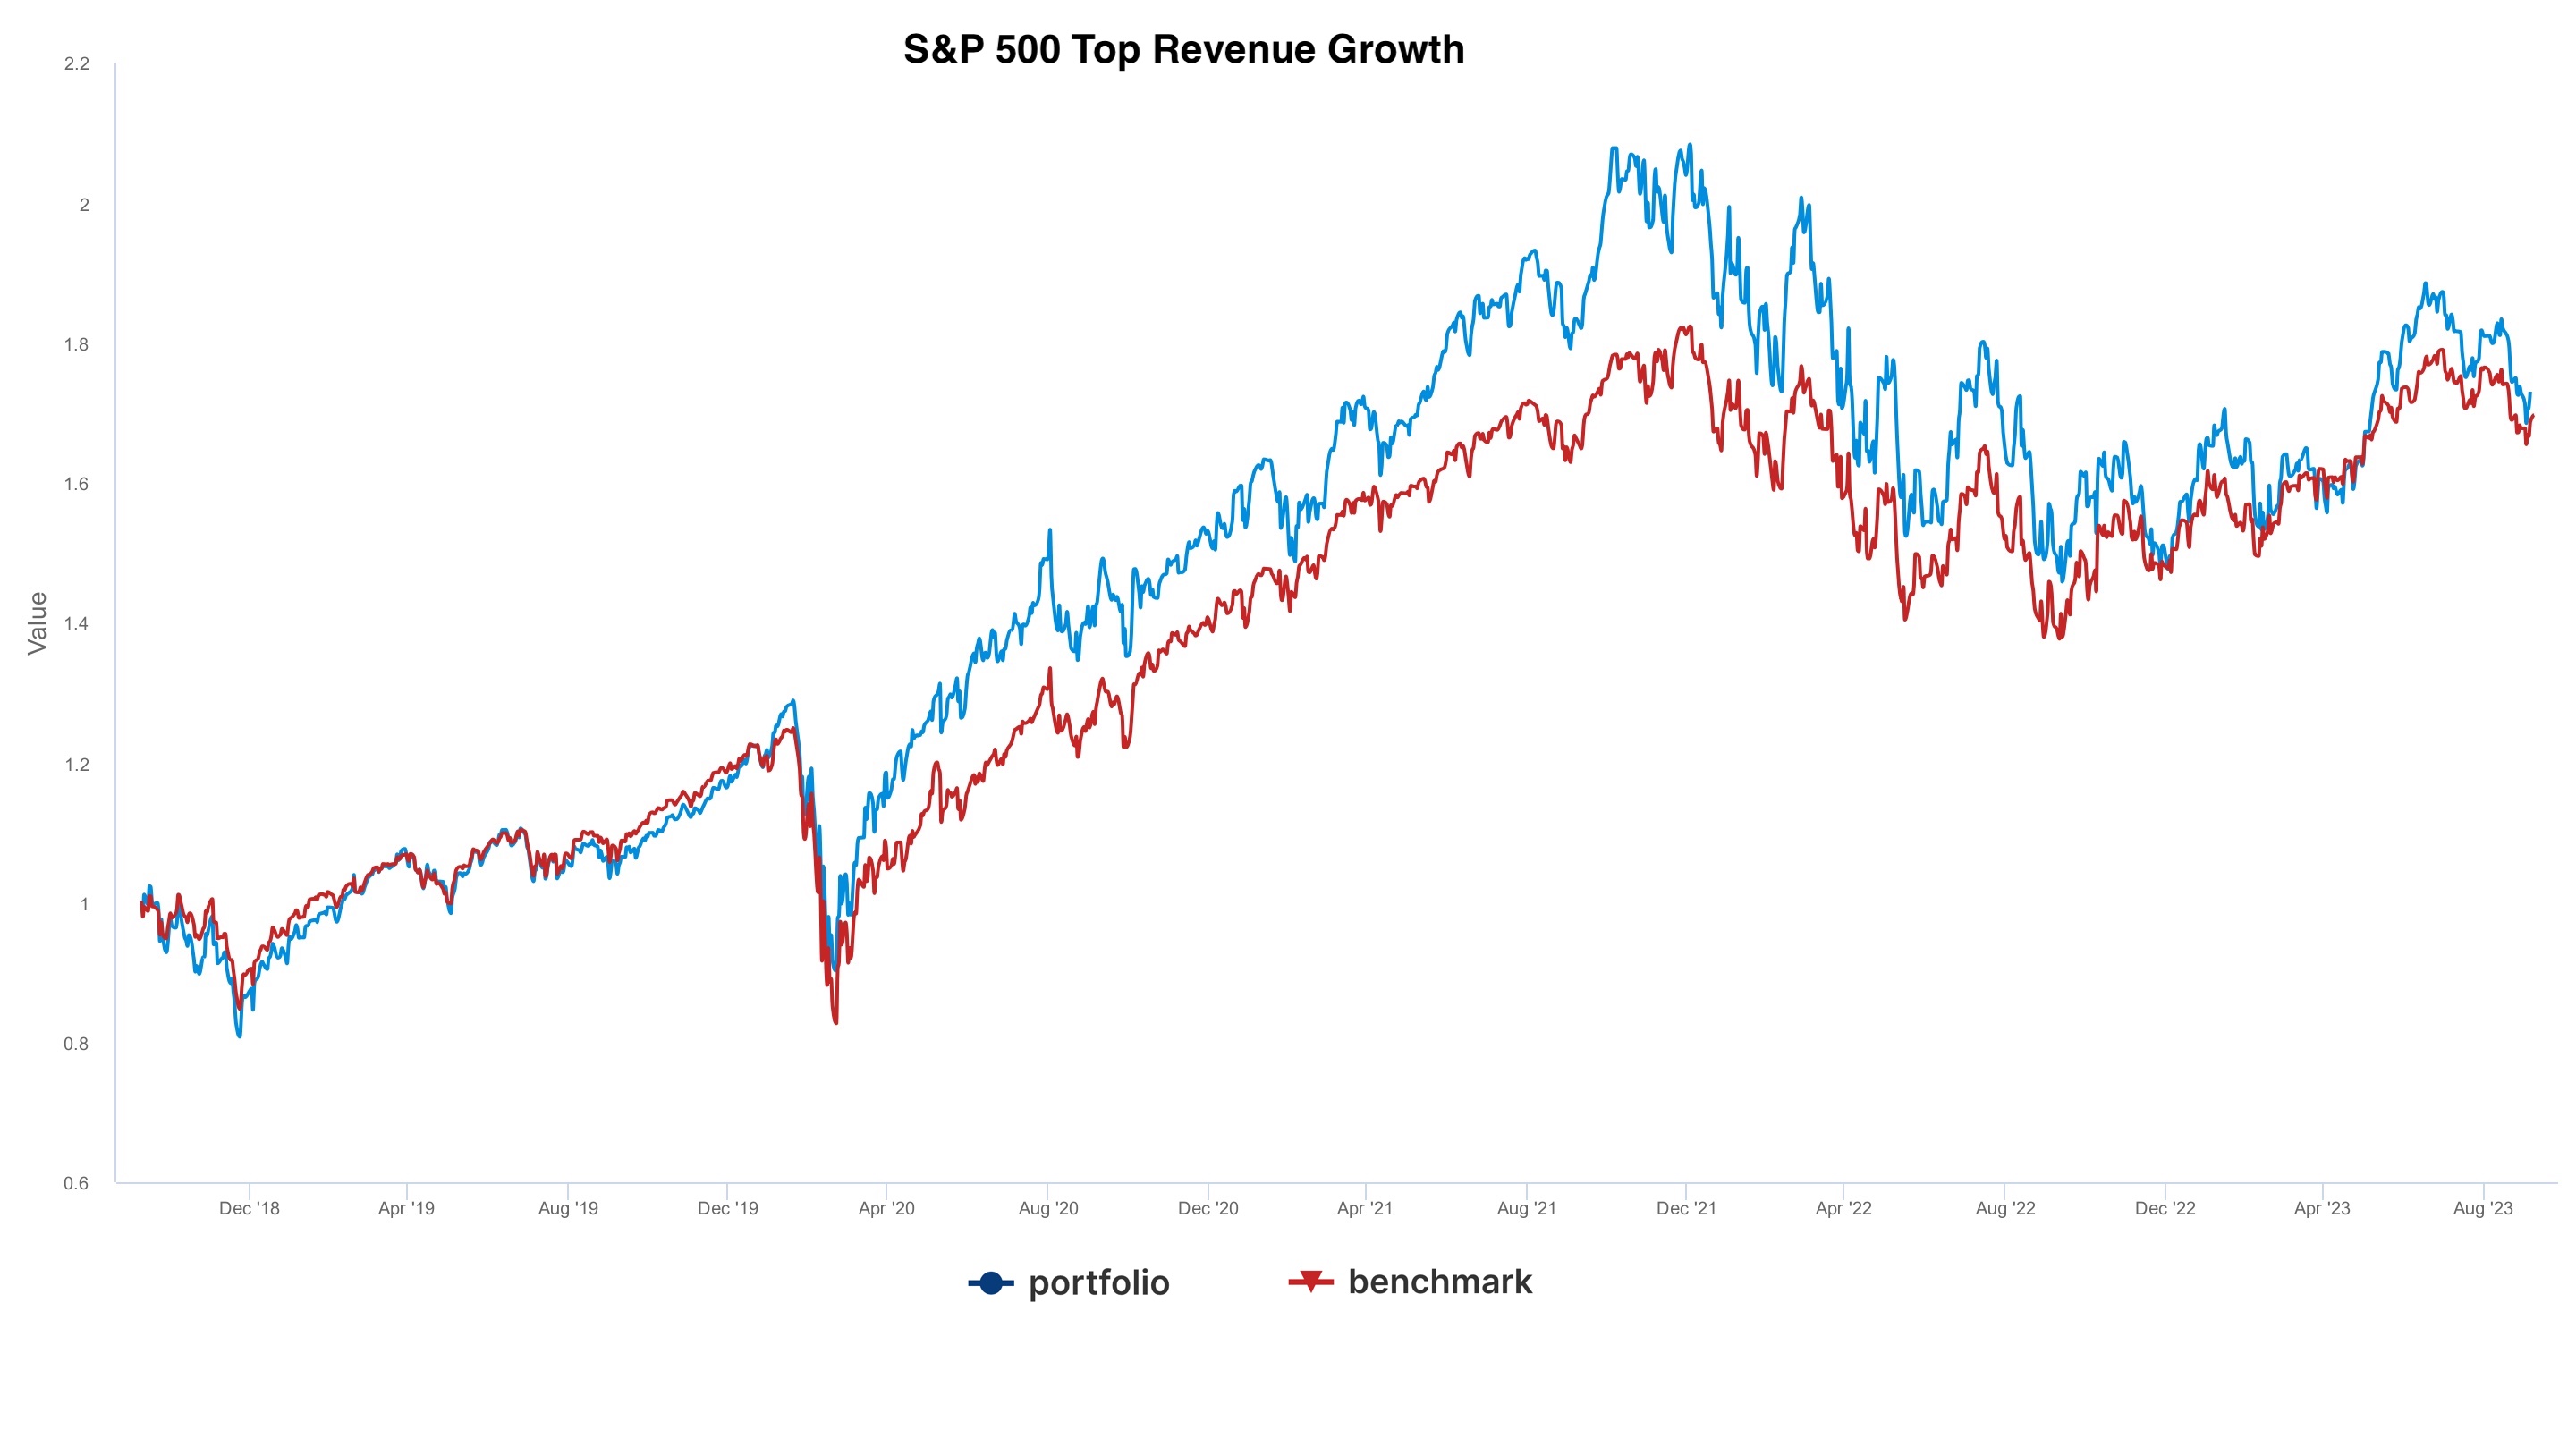
For the first strategy, “S&P 500 Top Revenue Growth”, we select one hundred stocks with the highest year-over-year revenue growth. Our list is rebalanced at the start of each quarter, involving a cross-sectional comparison across the universe during each cycle. Then, we construct a portfolio based on market cap weights and hold it until the next update. Below is the performance versus the S&P 500 Total Return as the benchmark:
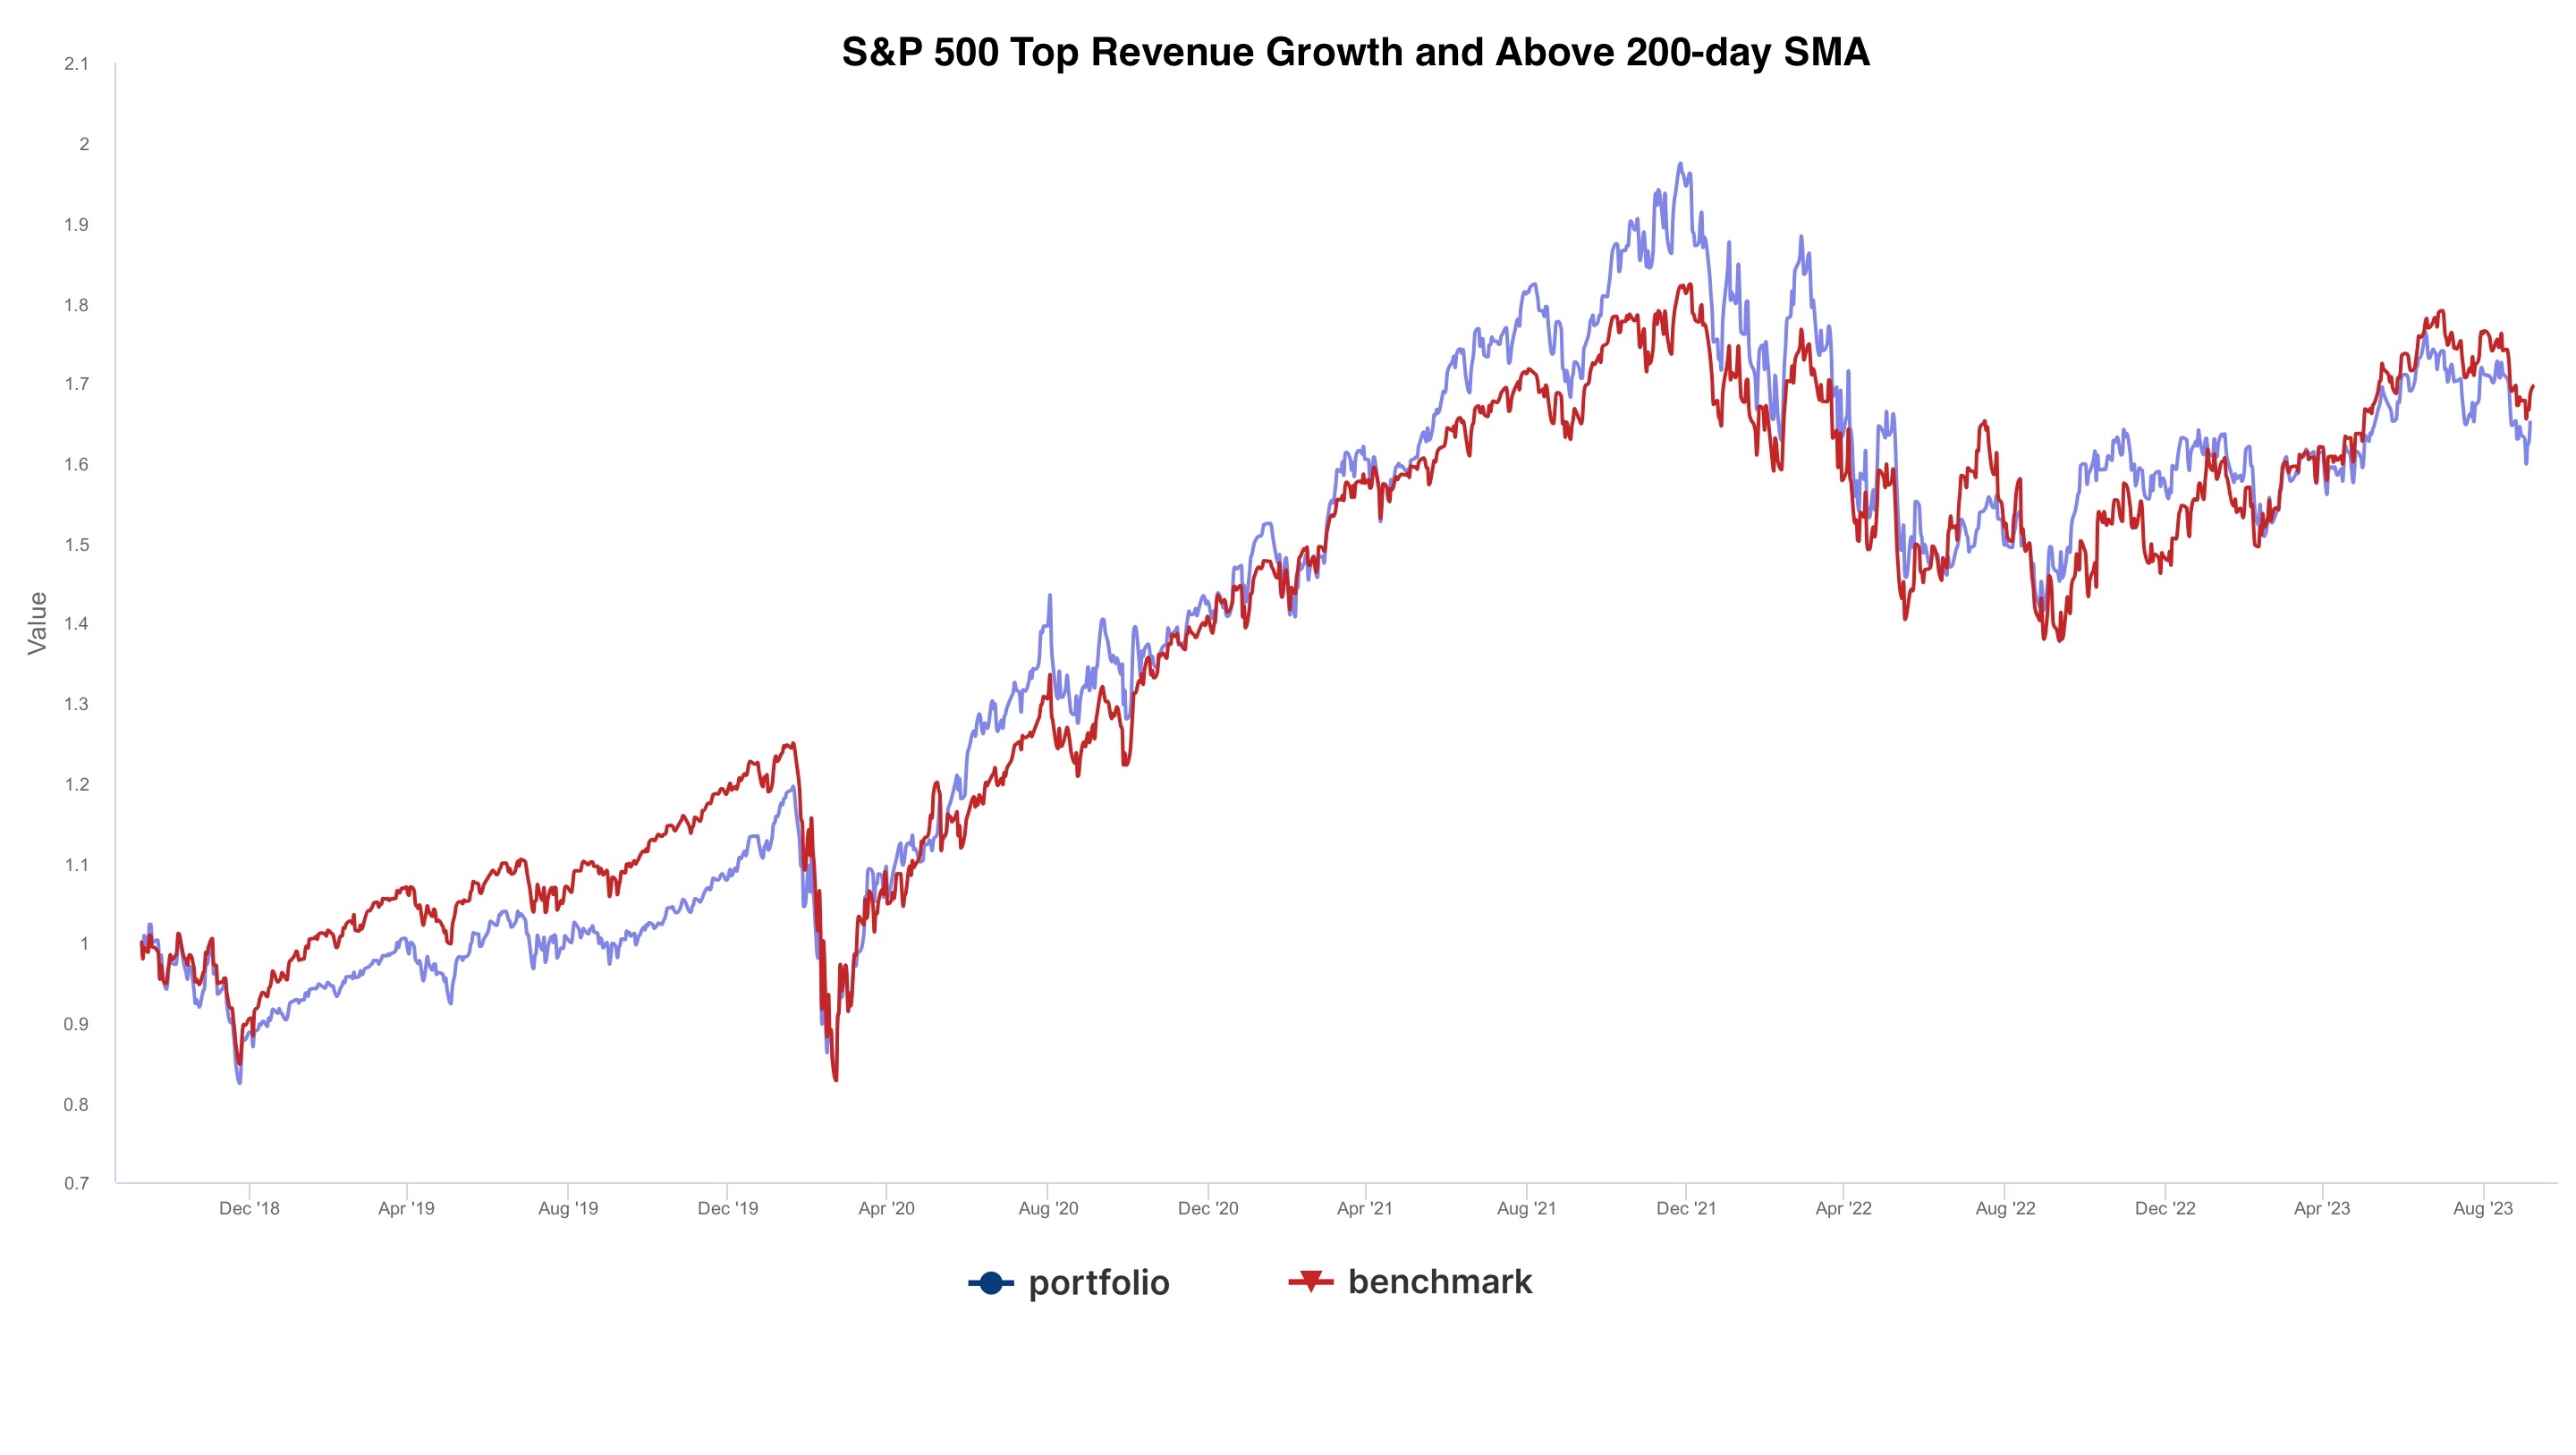
For the second strategy, “S&P 500 Top Revenue Growth and Above 200-day SMA”, we add the requirement that the selected stocks’ prices be above their respective 200-day simple moving averages. Note that these are time-series conditions, meaning they are applied to each stock’s own history. Similarly, we rebalance our list at the start of each quarter and form a portfolio using market cap weights. Below is the performance versus the S&P 500 Total Return as the benchmark:
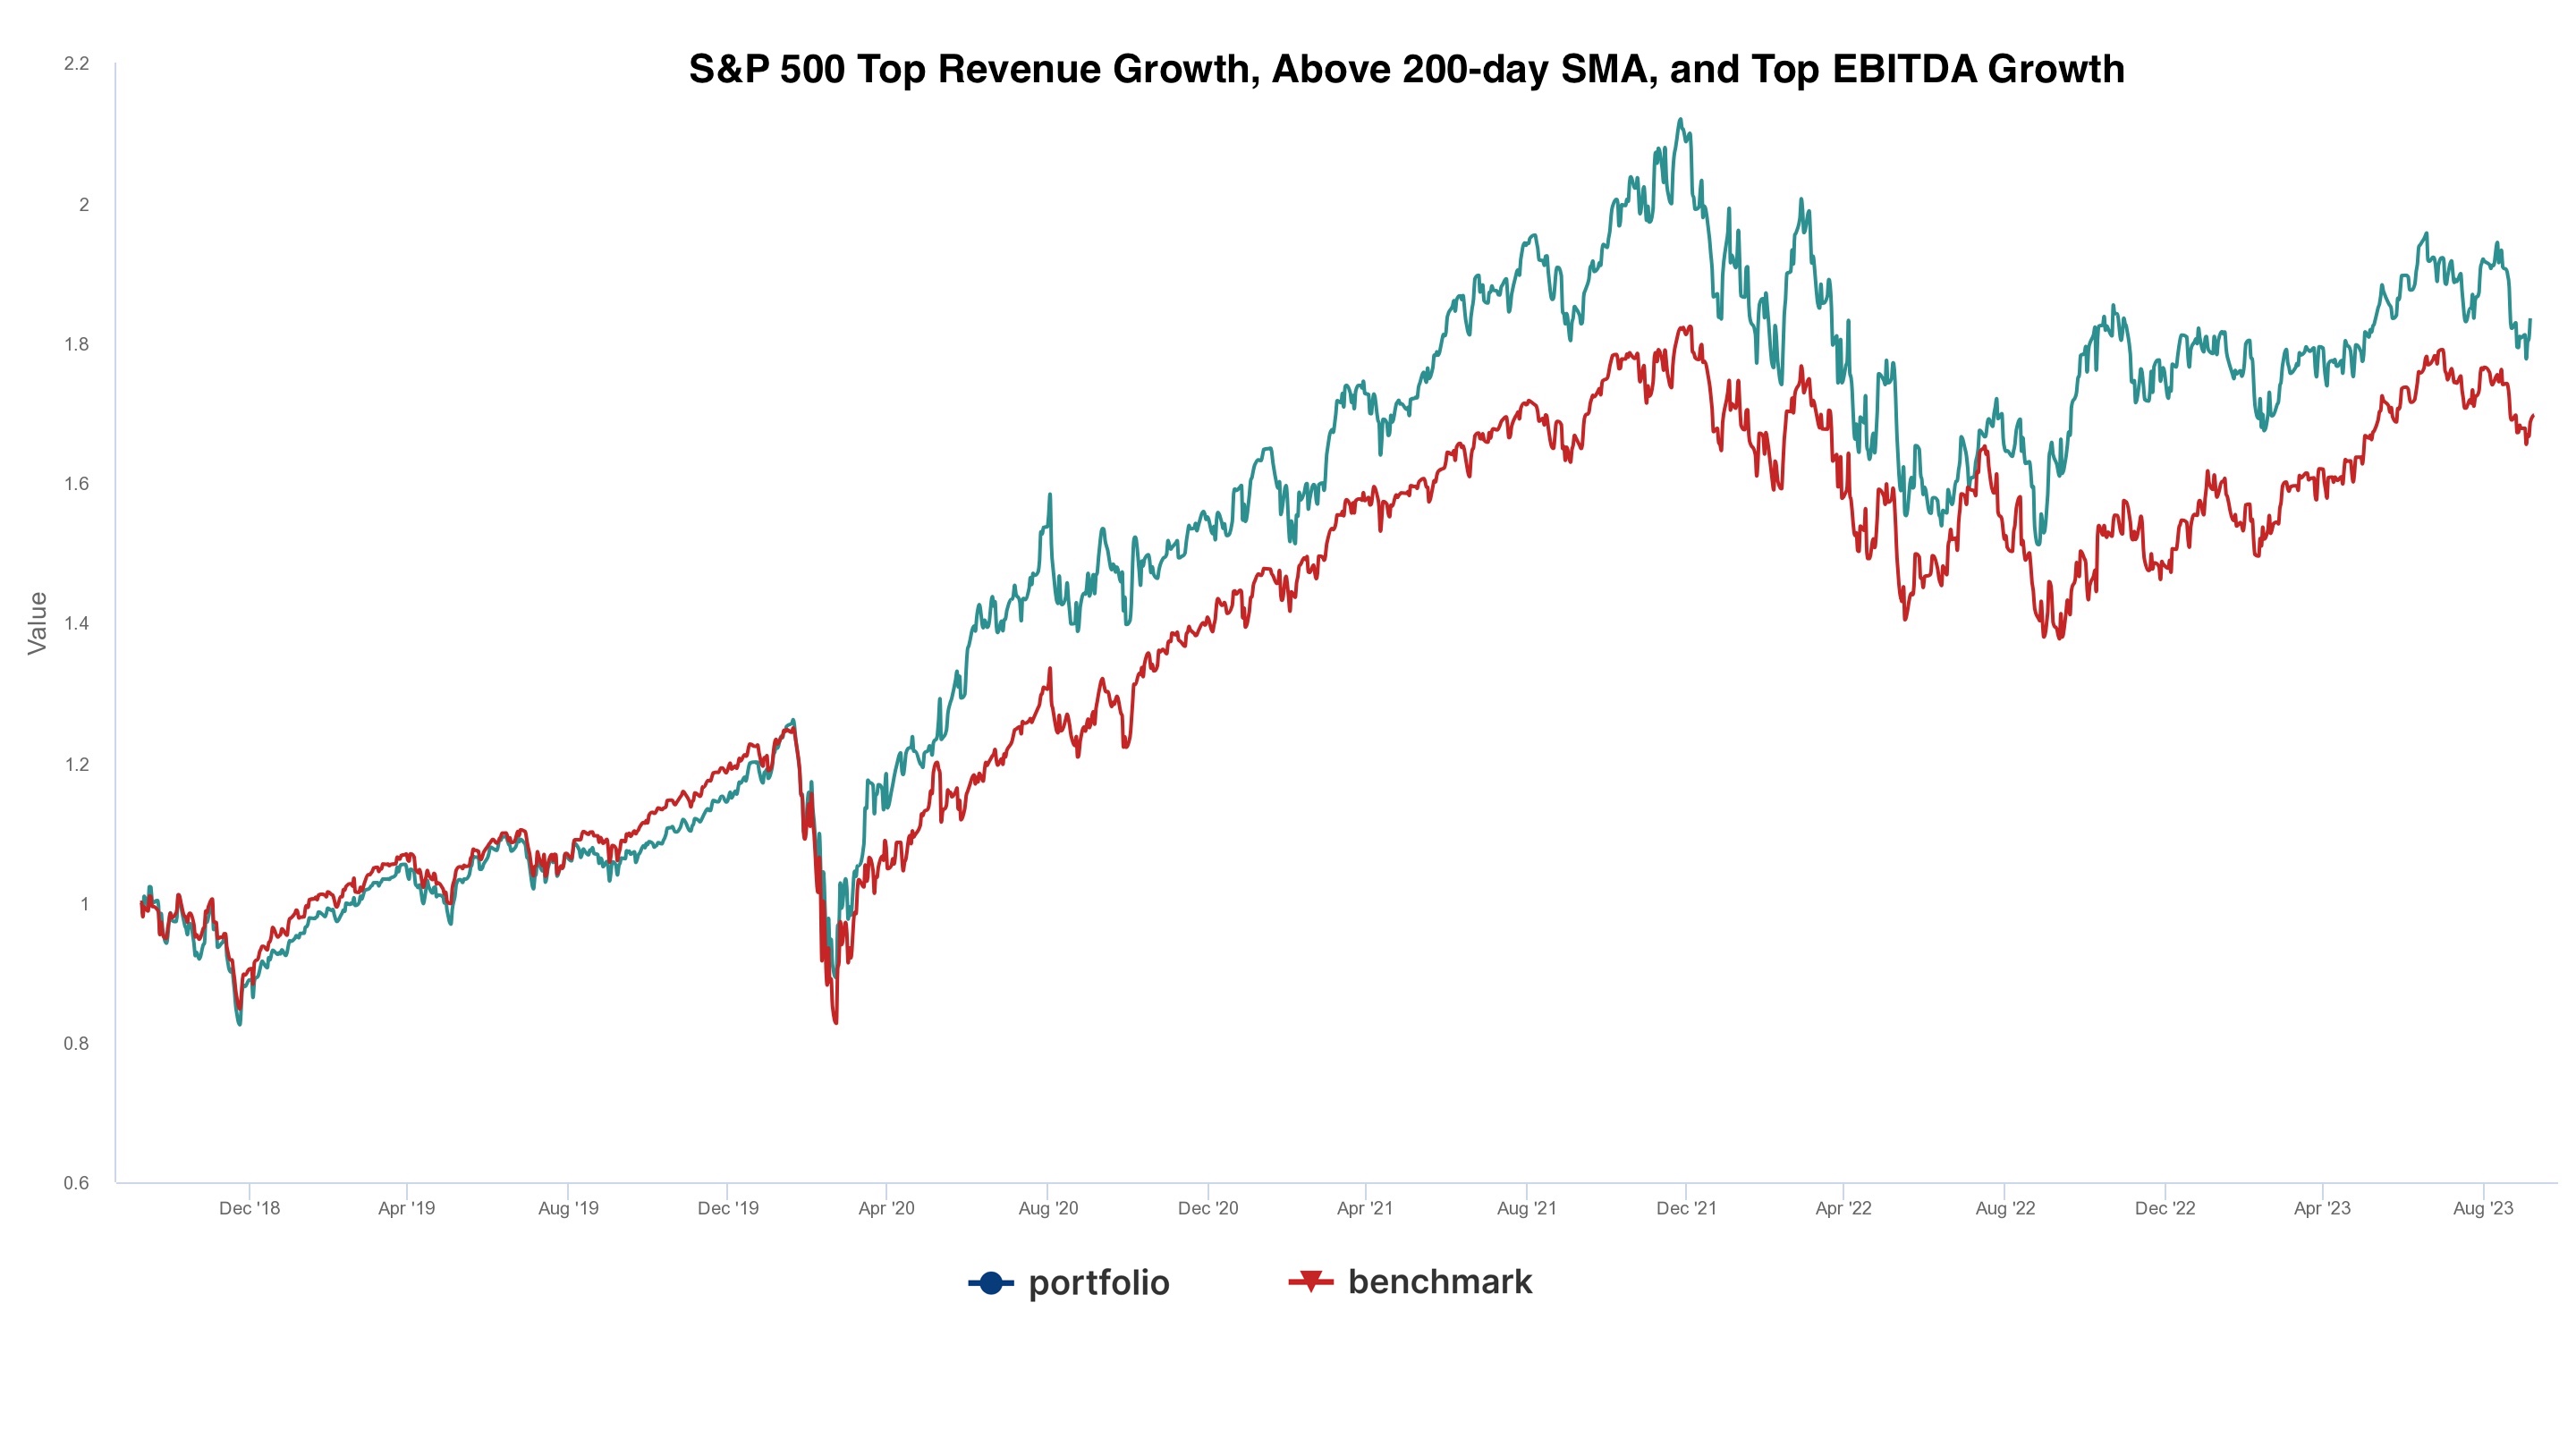
For the third strategy, “S&P 500 Top Revenue Growth, Top EBITDA Growth, and Above 200-day SMA”, we introduce an additional fundamental variable: year-over-year EBITDA growth. In this strategy, we first select the top forty percent of stocks with the highest year-over-year revenue growth from the available universe. Next, we choose the top one hundred stocks with the highest year-over-year EBITDA growth. Finally, we require the selected stocks’ prices to remain above their respective 200-day simple moving averages. Again, we rebalance our list at the beginning of each quarter and construct a portfolio based on market cap weights. Below is the performance versus the S&P 500 Total Return as the benchmark:
Using OdinUltra, the no-code specialized financial AI platform developed by Big Data Federation Inc., investors can quickly backtest the above strategies in a matter of minutes. Further details like Sharpe Ratio, Cumulative Return, Standard Deviation, Maximum Drawdown, and more are available on OdinUltra. Users can also utilize OdinUltra for side-by-side comparisons:
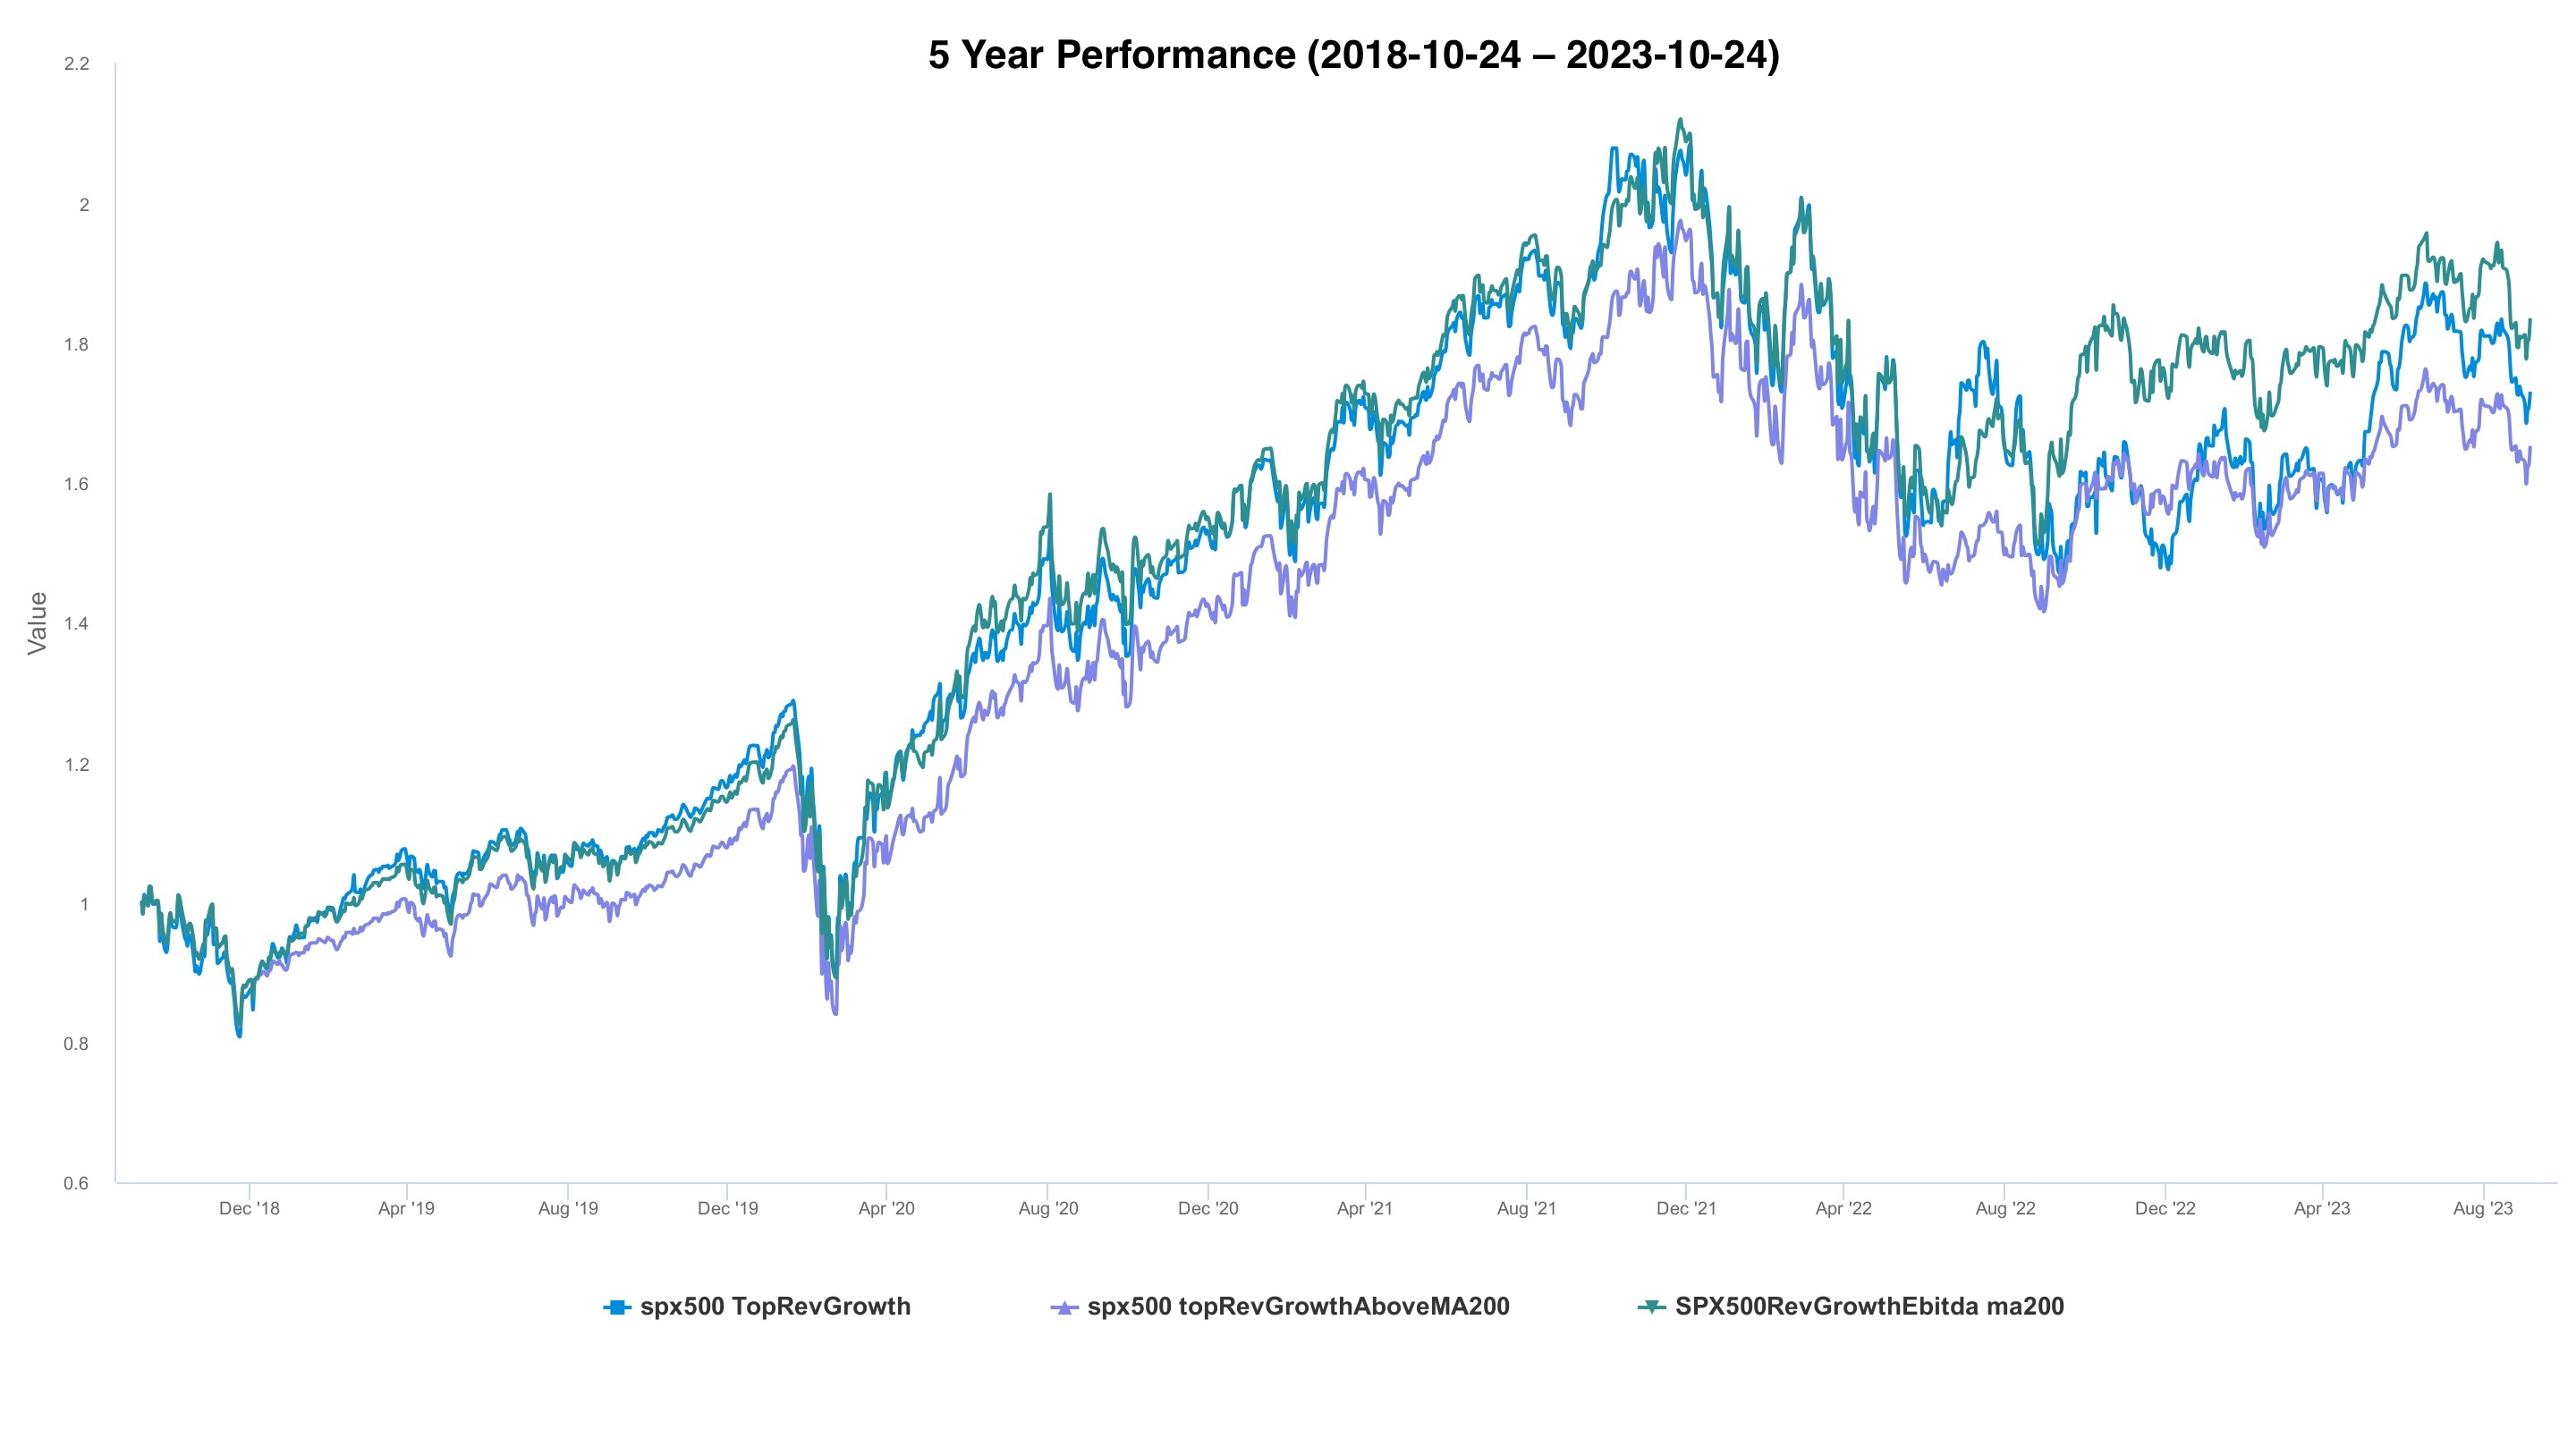
We can also examine the performance details of these strategies for specific periods, such as the 2022 bear market. In this scenario, we observe that the first strategy underperformed the benchmark. However, after the addition of EBITDA growth and a stop loss of above 200-day SMA, the third strategy outperformed the benchmark:
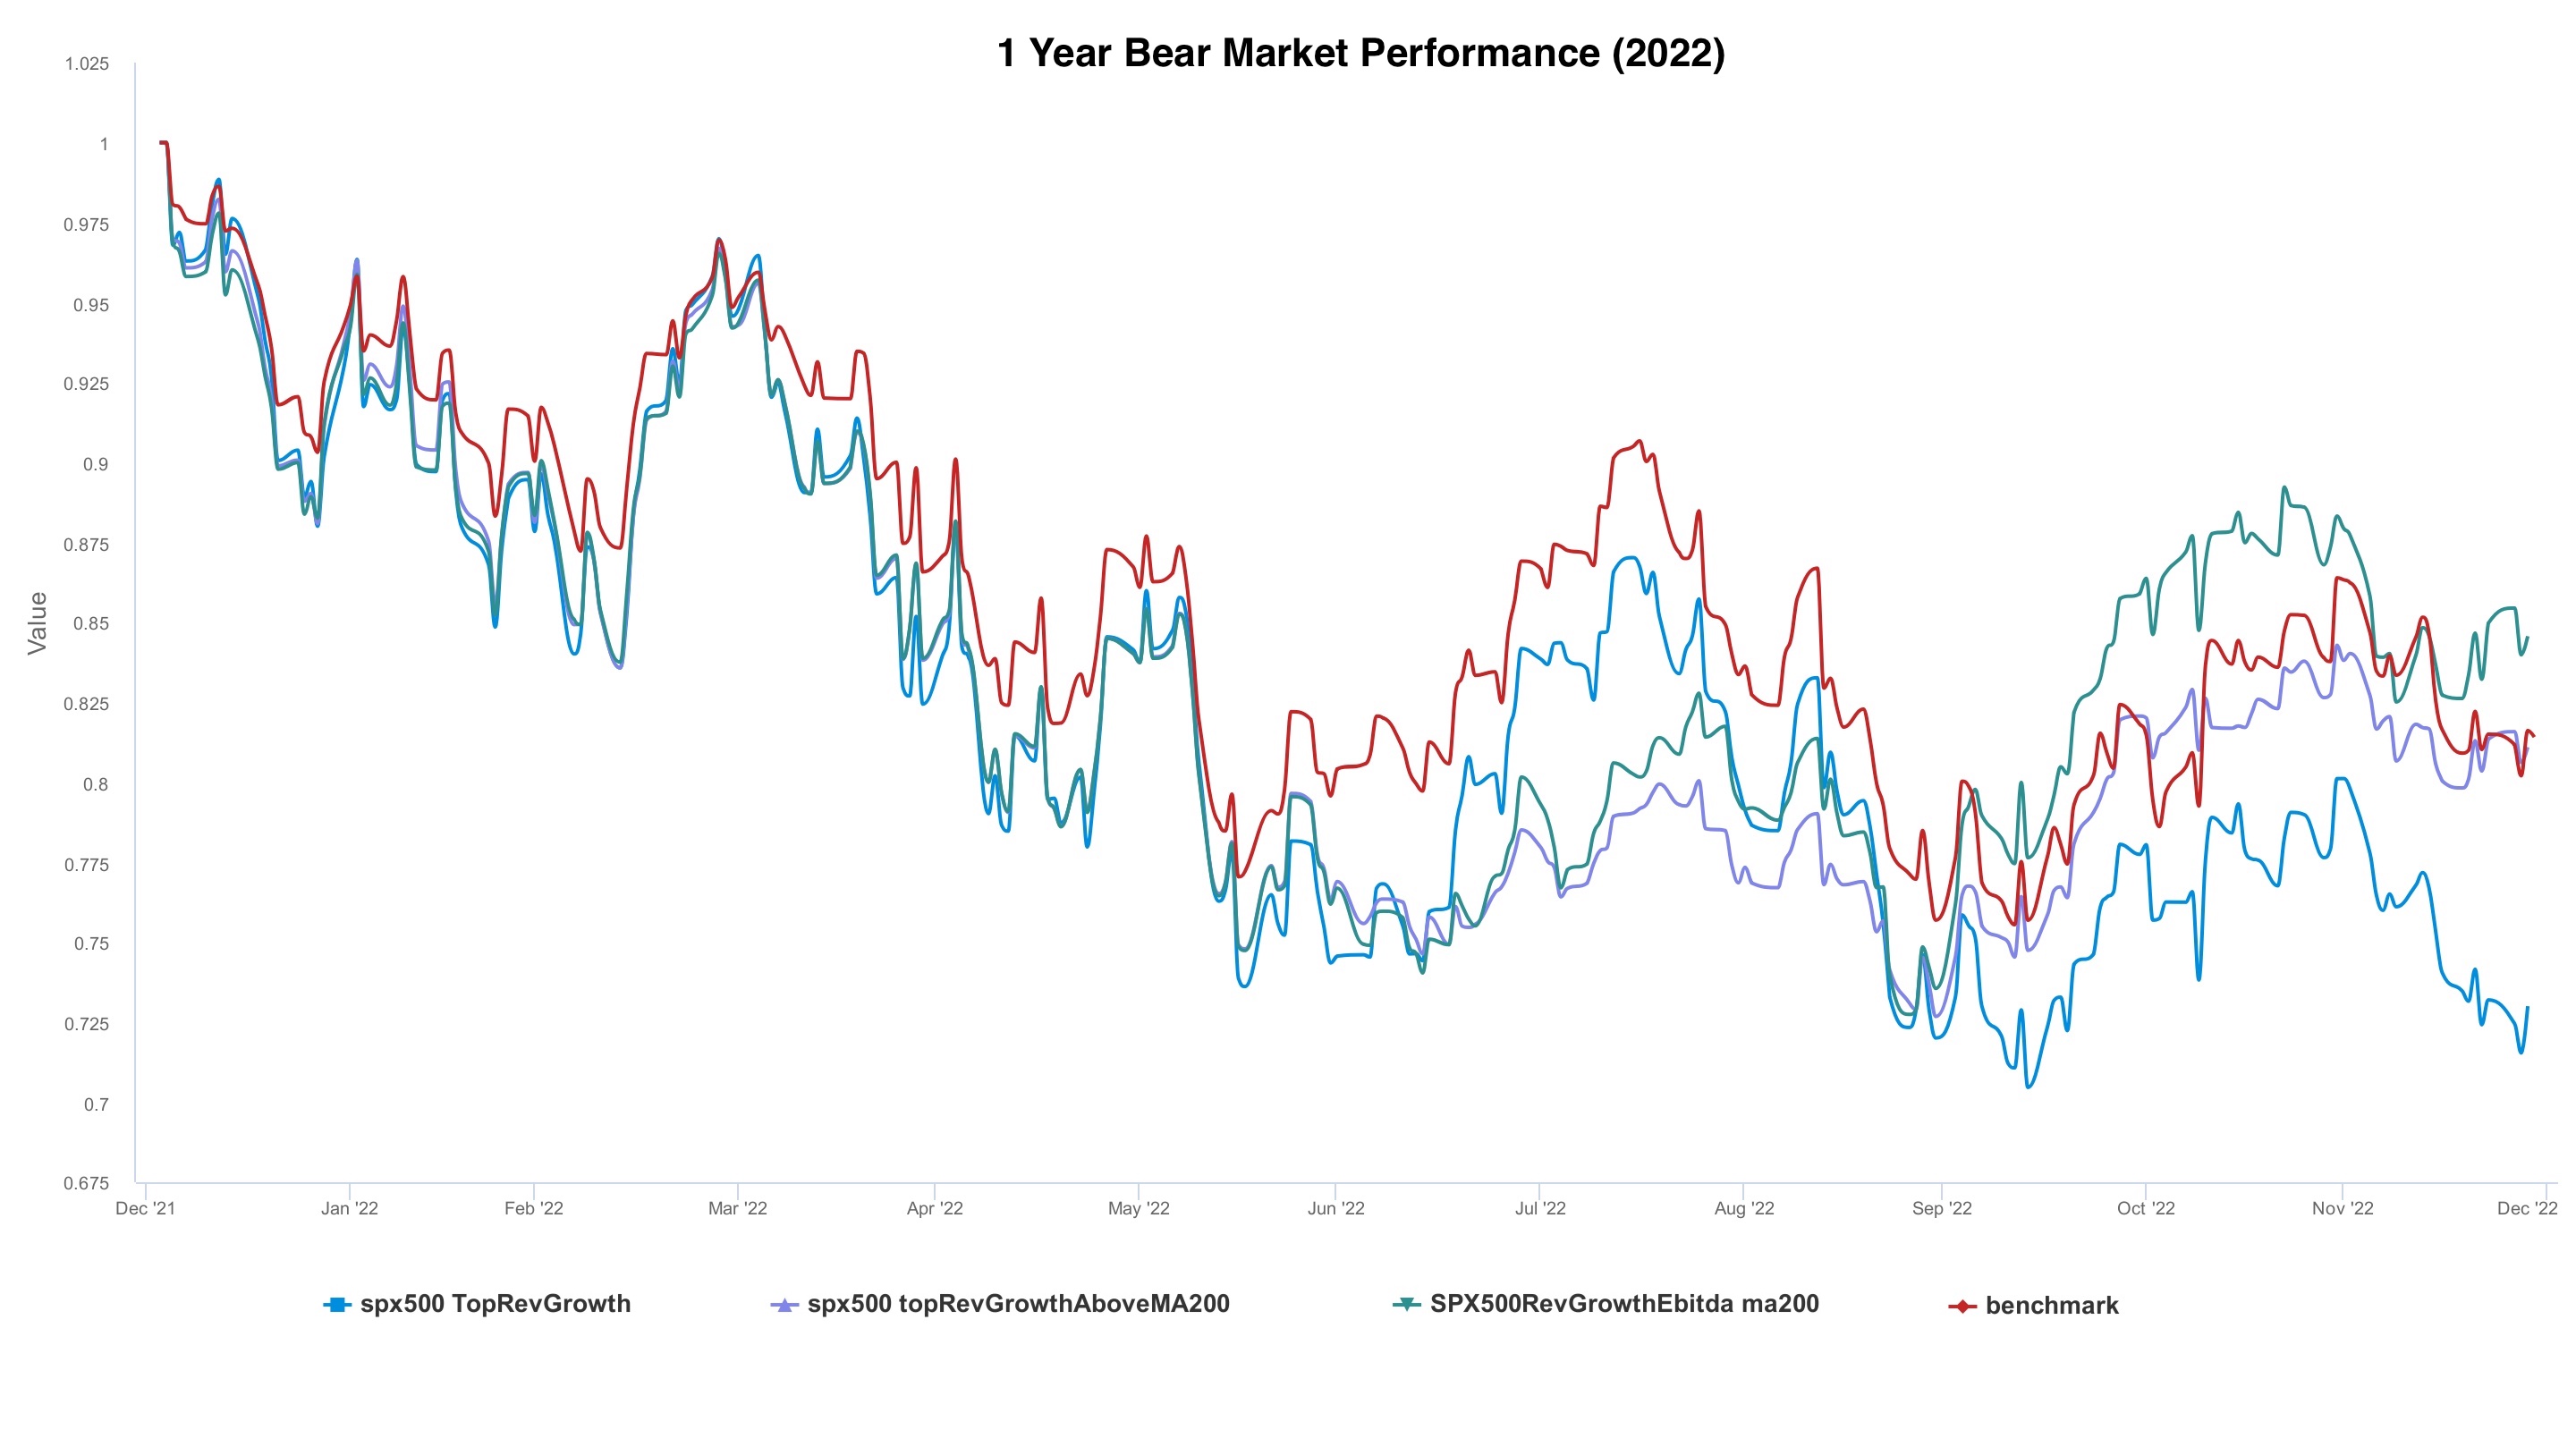
Backtesting these strategies requires our calculation engine to accurately trace the historical S&P 500 composition and identify the correct lists of stocks. Data cleansing, modeling, and validation are essential parts of the process. For a typical quantitative researcher, generating the above results can take anywhere from a few days to several weeks, depending on data availability and technology infrastructure. With OdinUltra, these tasks can be accomplished in just a few minutes. Users can also download position and NAV details for further study from OdinUltra if desired.
In conclusion, combining year-over-year revenue growth, year-over-year EBITDA growth, and a technical condition of above 200-day SMA yields a better large-cap strategy versus the S&P 500 Total Return index. Users can quickly generate detailed backtest results and may further improve on these results using OdinUltra, which empowers asset managers to leverage their domain expertise throughout the entire investment process to explore, construct, verify, and deploy investment ideas and theses quickly.
About OdinUltra
OdinUltra is a cutting-edge no-code specialized AI platform, designed to cater to a wide array of professionals in the asset management industry. It is a battle-tested specialized partner that empowers users including discretionary, quantitative, multi-asset, and multi-strategy managers to harness the immense potential of big data and sophisticated investment techniques. From idea exploration and construction to verification and deployment, OdinUltra is an all-encompassing tool. Asset managers can enhance existing products and rapidly develop new ones, securing a competitive edge in the dynamic world of asset management.
Published by Big Data Federation · All insights · Subscribe to Insights