Turbulence Ahead for Air Freight
By Big Data Federation, Inc.

-
Global air freight volume declined across the board
-
Available freight tonne kilometers shrank in response to falling demand
-
Earnings disappointed as companies cited worsening macroeconomic challenges
Air freight is facing mounting pressures from recent economic volatility and geopolitical conflicts. In another signal of slackening demand, global air cargo volume – measured by freight tonne kilometers (FTK) – declined across the board (-2% MoM/ -8% YoY/ - 3% YoY3). Tailwinds such as heightened consumer goods demand, retailers’ seasonal inventory buildup, new export orders, and more have cooled.
|
Data (August) |
MoM |
YoY |
YoY31 |
|
Freight Tonne Kilometers (FTK) |
-2% |
-8% |
-3% |
|
Available Freight Tonne Kilometers (AFTK) |
-1% |
6% |
-8% |
|
Freight Load Factor |
-1% |
-14% |
6% |
Source: Big Data Federation, Inc.
Available freight tonne kilometers (AFTK), which measures supply via airline’s cargo carrying capacity, shrank in response to the falling demand (-1% MoM/ -8% YoY3). Capacity remains elevated compared to last year (6% YoY), as air cargo benefited from the unpredictable nature of supply and demand during the pandemic, emerging as a fast, efficient, and reliable mode of transport amidst supply chain disruptions. Flushed with cash from elevated marine freight rates of the past couple of years, even some major ocean shipping companies opted to purchase cargo planes.
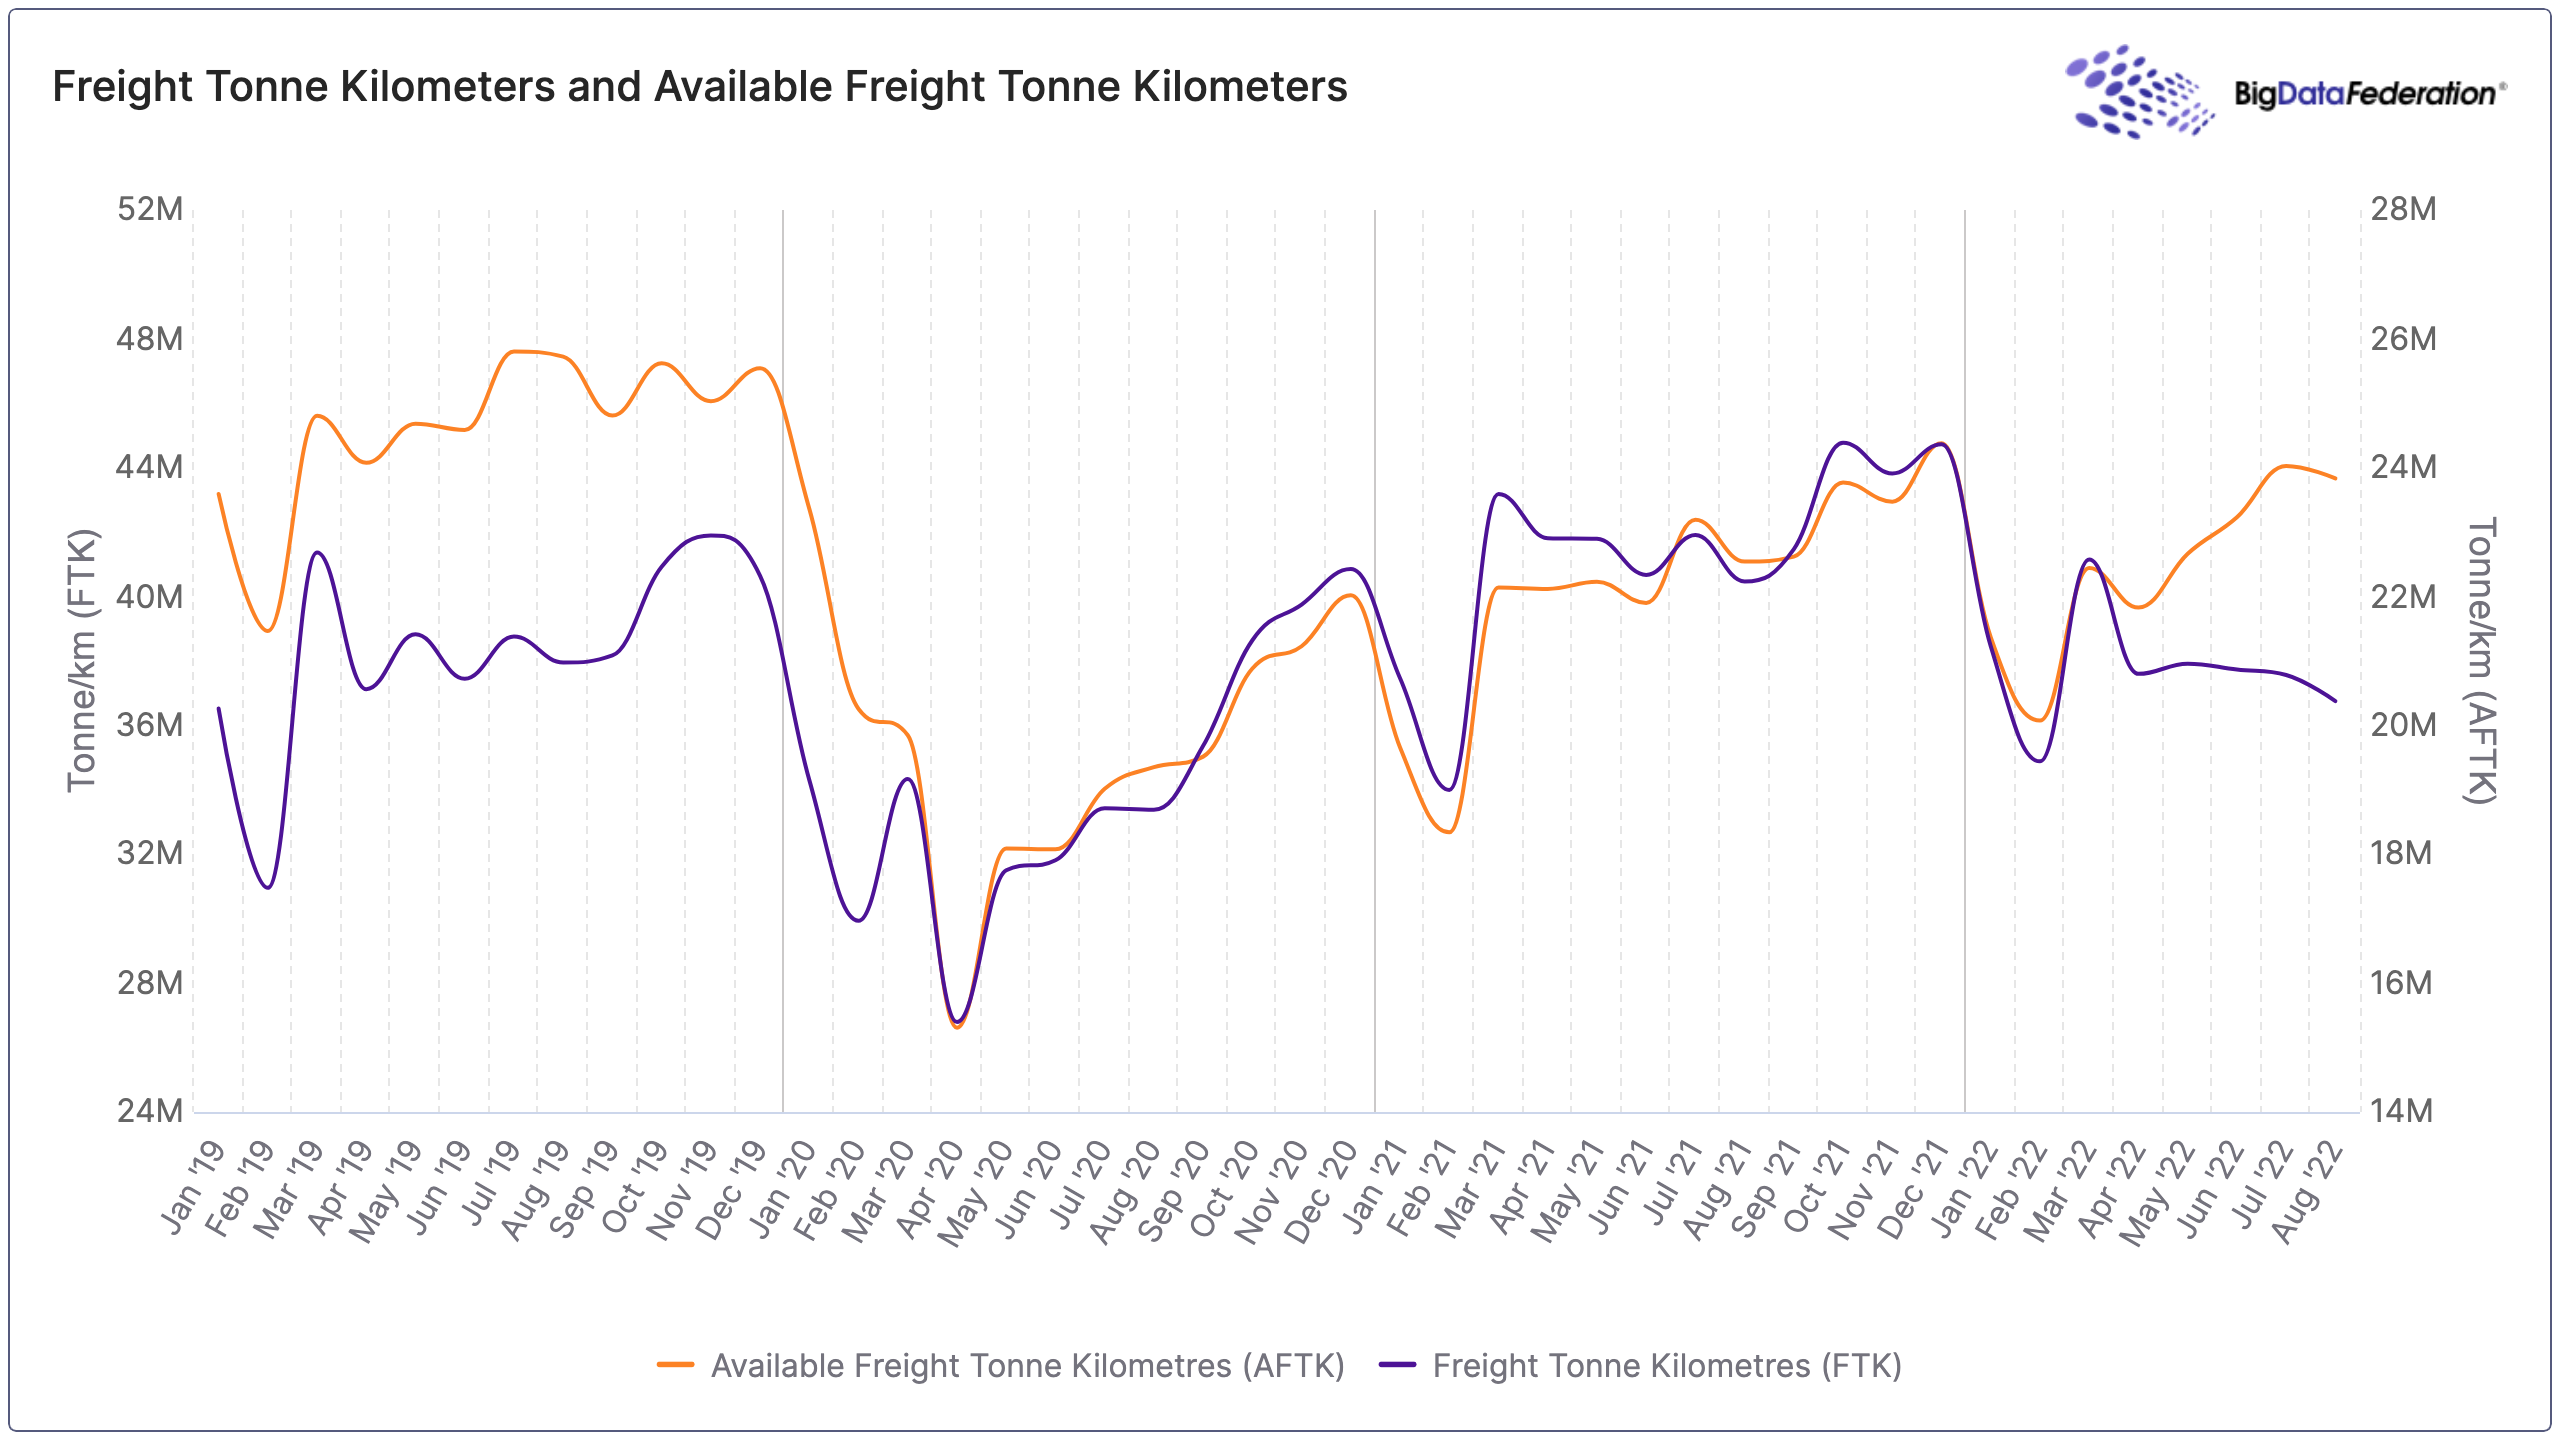
Recent earnings disappointed with weaker-than-expected results, significantly impacted by softening global volume stemming from worsening macroeconomic challenges, particularly in Asia and Europe. Companies recognized the need to control costs, bolster productivity and improve efficiency, announcing efforts to slow hiring, close locations, and consolidate operations, amongst other actions. Freight load factor, a performance indicator that calculates the percentage of available cargo capacity loaded with goods reflected the deceleration (-1% MoM/ -14% YoY), although, it was above pre-pandemic levels (6% YoY3).
1 YoY3 = compared to August 2019
Published by Big Data Federation · All insights · Subscribe to Insights