S&P Futures on a 1-Minute Chart
By Big Data Federation, Inc.

Intraday traders often use mean-reversion strategies to capture short-term price recoveries. One way to test this approach is to buy when the market trades below a moving average, anticipating a rebound toward its recent average price. Here, we use Financial AI® to backtest a systematic S&P futures strategy built around a simple rule: buying below the 10-period moving average on a 1-minute chart.
The 10-period moving average provides a rolling reference for recent price action. When S&P futures trade below this level, the strategy identifies a potential buying opportunity. This approach seeks to capture brief pullbacks throughout the day, although prices can continue falling rather than reverting toward their average.
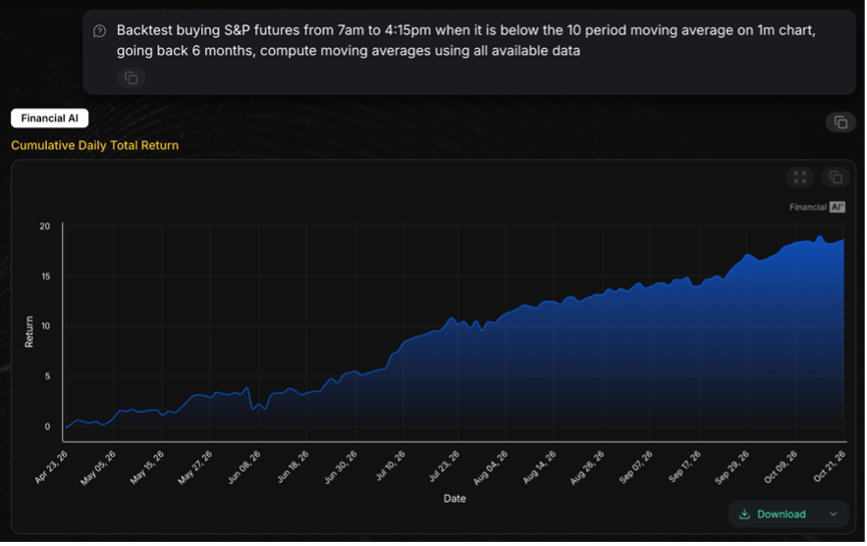
Our strategy is straightforward. Over a six-month period, we test buying S&P futures when the price is below its 10-period moving average on 1-minute bars, with trading restricted to 7:00 a.m. through 4:15 p.m. The moving average is calculated using all available price data, including bars outside the trading window, so the indicator continues across sessions rather than resetting each morning. The strategy’s performance is shown below.
 |
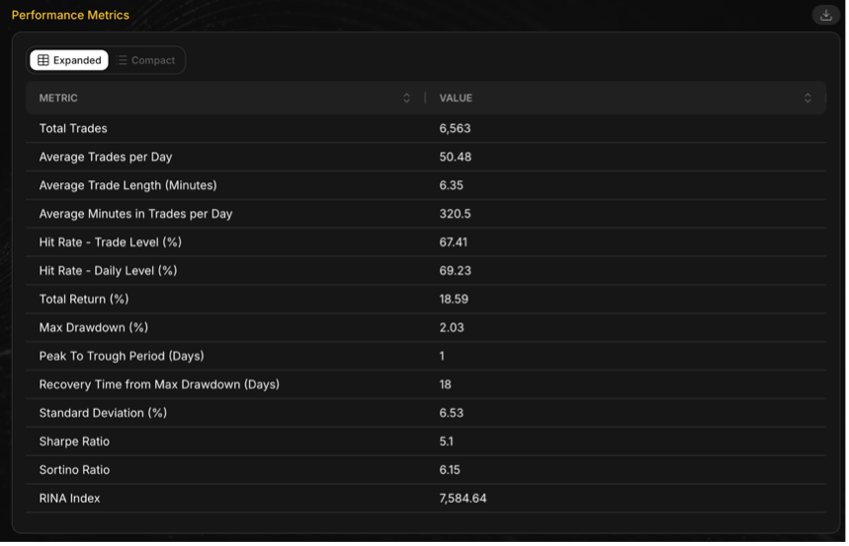 |
Over the six-month backtest, the strategy generated 6,563 trades, averaging 50.48 trades per day, with an average holding period of 6.35 minutes. It produced an 18.59% total return, a 5.10 Sharpe ratio, and a maximum drawdown of 2.03%. The strategy recorded a 67.41% trade win rate, while 69.23% of trading days were profitable, showing how a simple moving-average rule performed across thousands of intraday trades during the tested period.
Published by Big Data Federation · All insights · Subscribe to Insights