Risk Continues Brewing in Regional Banks
By Big Data Federation, Inc.

We all witnessed the demise of two large US banks, Silicon Valley Bank and Signature Bank, last week. Bank failures are not unusual, an average of 3.75 have occurred every year since 2015. But the swiftness with which these large banks fell triggered alarm bells that a systemic crisis could engulf the financial system. Our in-depth analysis leads us to believe the banking system is well capitalized, but we expect a few more regional banks to struggle in the near future.
Our algorithms combed deep into fundamentals to pattern-match and identify publicly traded banks with similar risks as Silicon Valley Bank and Signature Bank. As part of the process, we aggregated industry metrics across all U.S. regional and large banks.
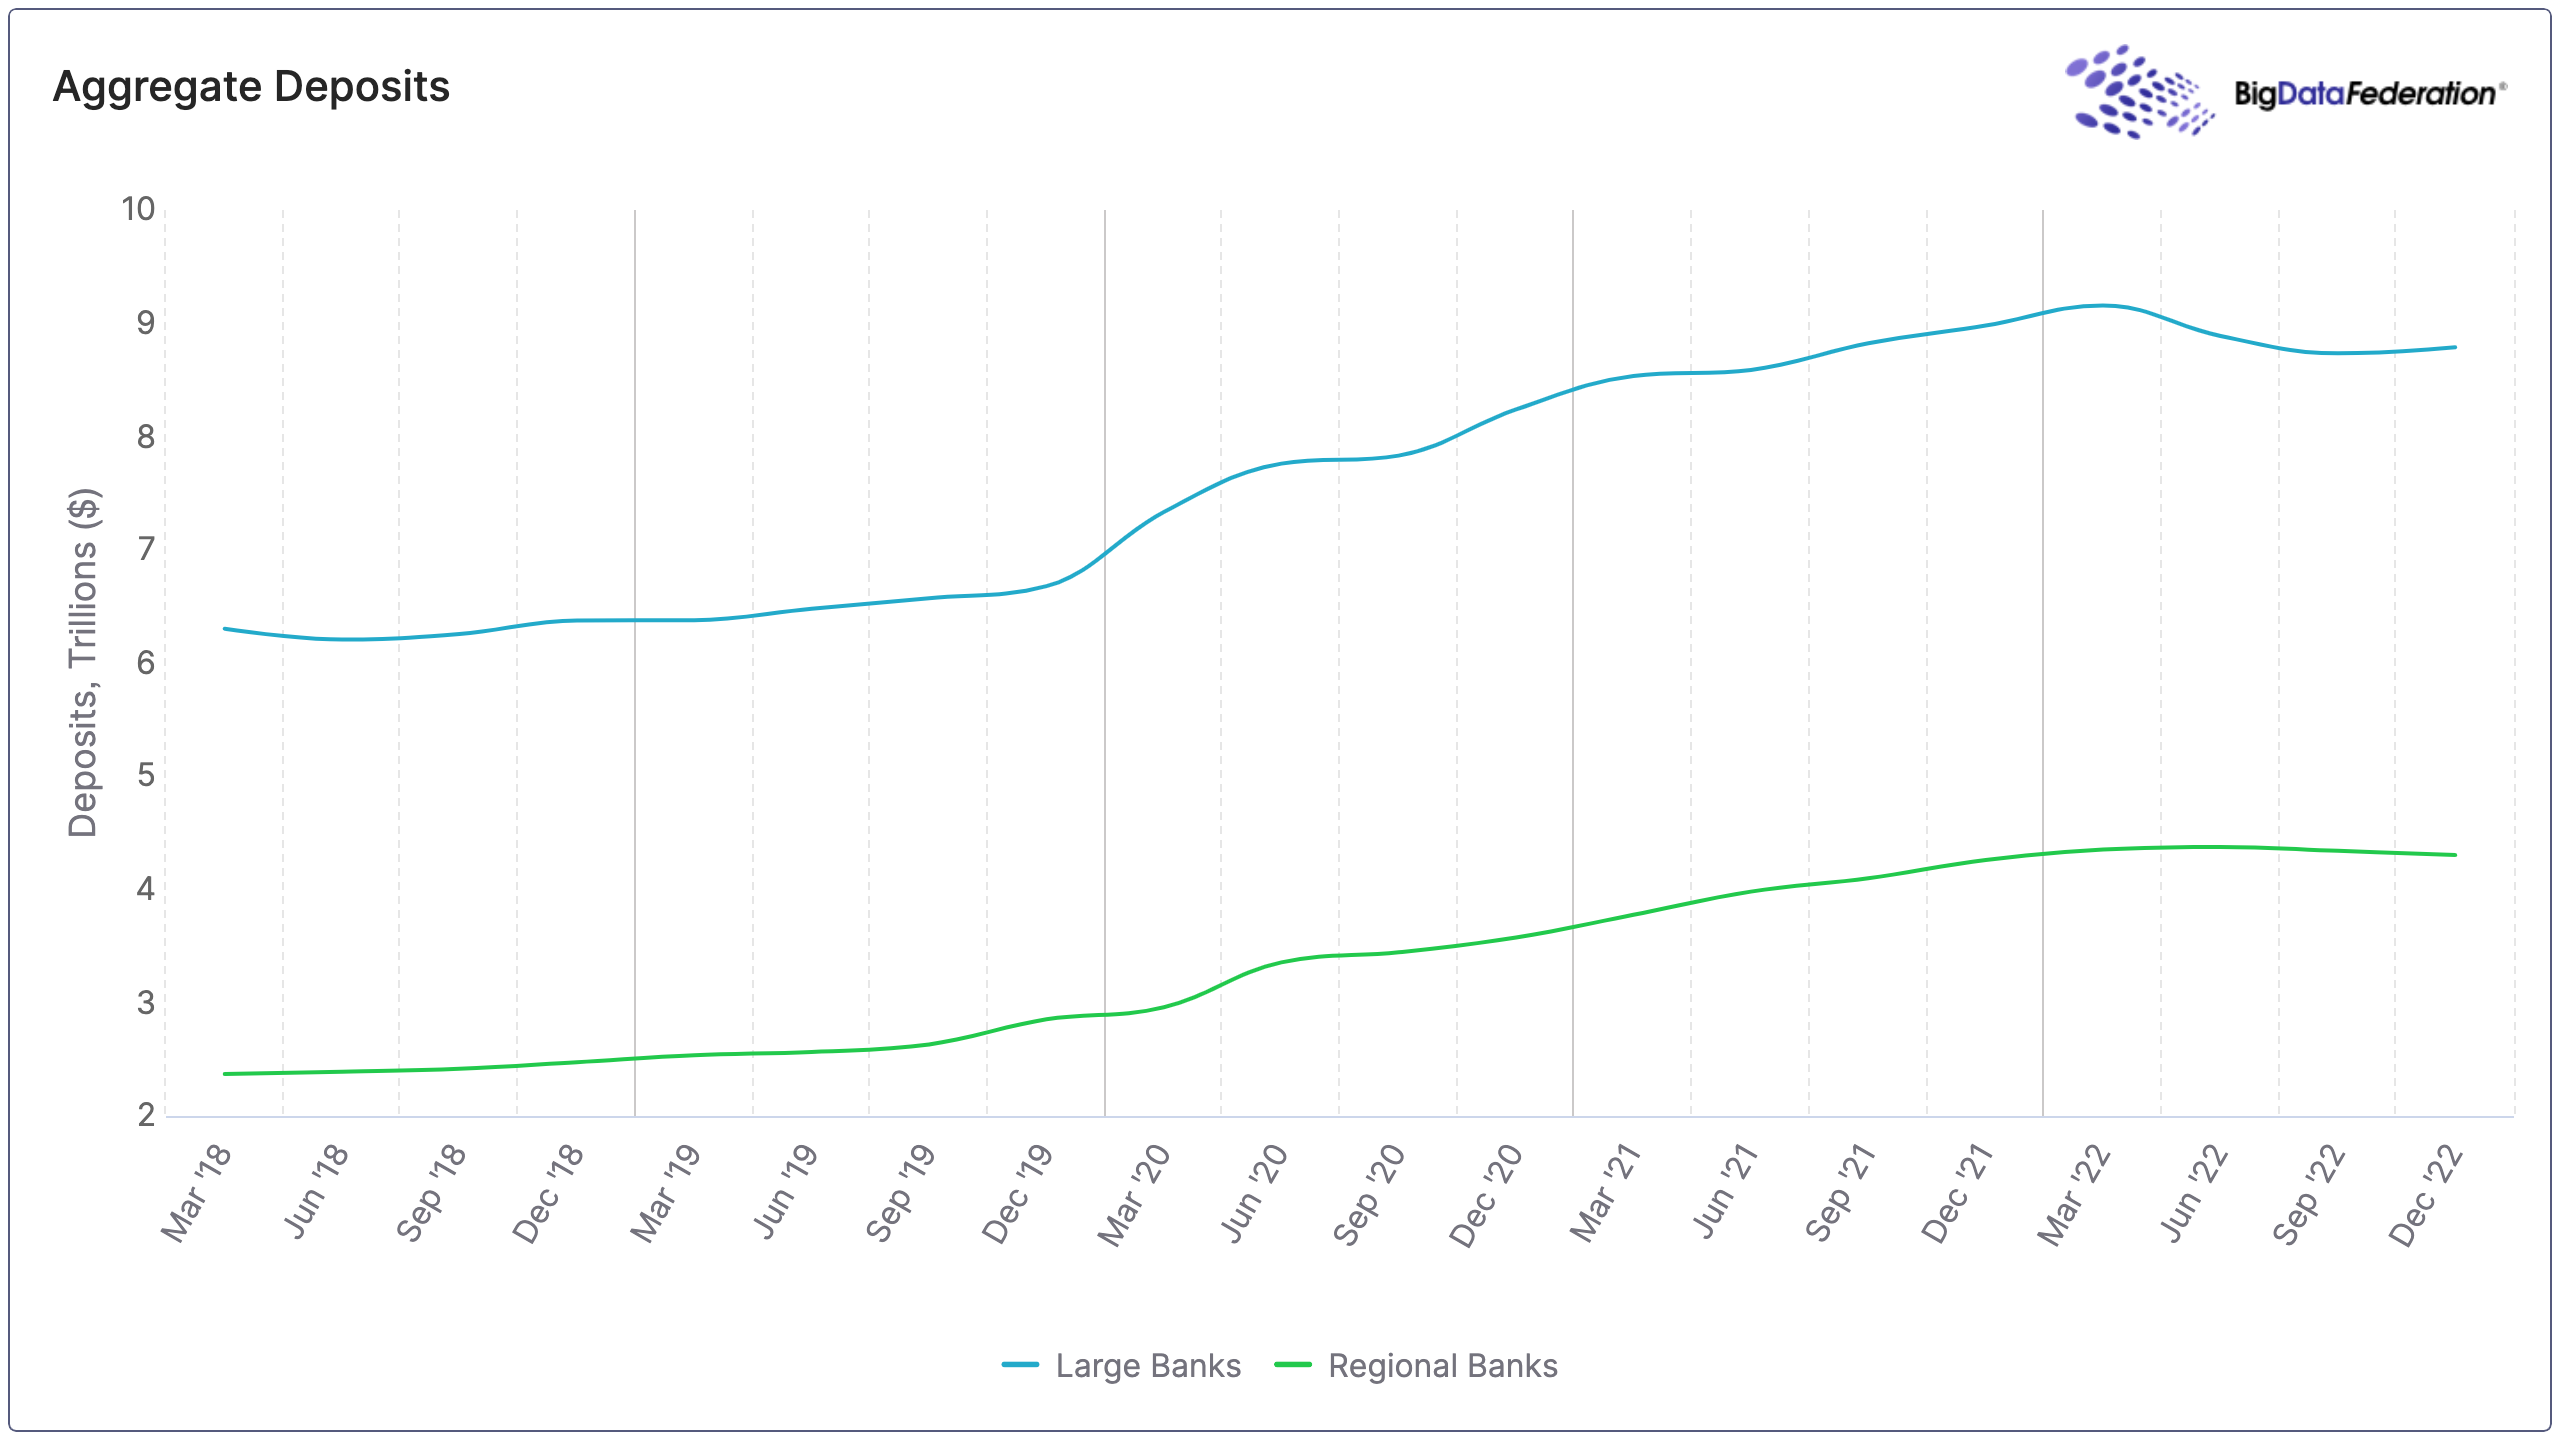
Large banks’ deposits have slightly fallen, while regional banks’ deposits have flattened; it is not alarming and within the realm of normal, especially considering consumers are going through their pandemic-induced excess savings.
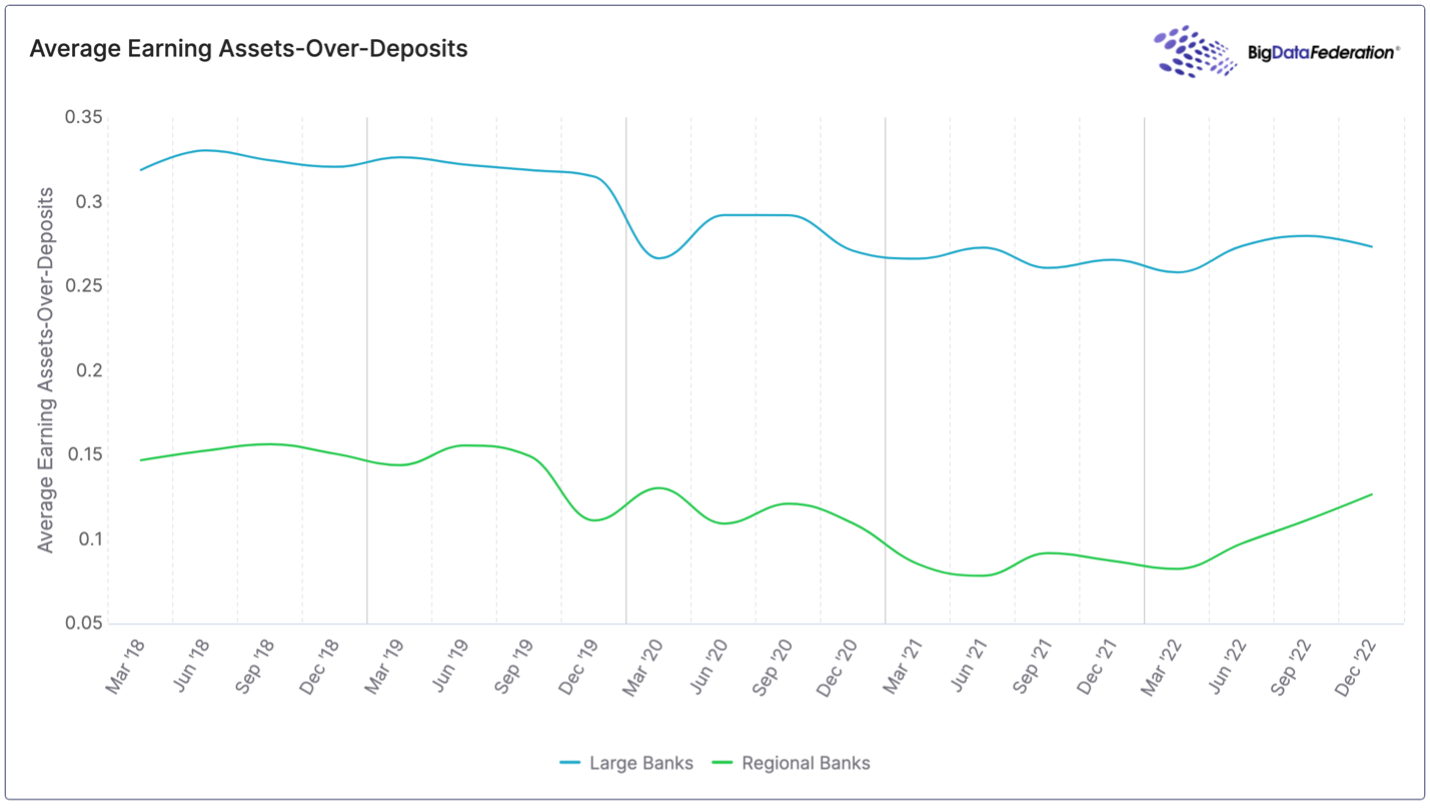
 A run on deposits was the main trigger for Silicon Valley Bank and Signature Banks’ collapses. Whether the banks could wholly cover outstanding deposits through asset liquidation became the central question. To quantify that risk, we aggregated earning assets, i.e., assets producing income for the banks, versus the outstanding deposits. Our analysis indicates, currently, earning assets have 27% excess value over deposits for large banks, and 13% for regional banks. In other words, if the FDIC took over to liquidate assets today, taxpayers would make money from the sale. However, it should be of note that asset valuations are performed internally by the banks themselves, and there could be inefficiencies.
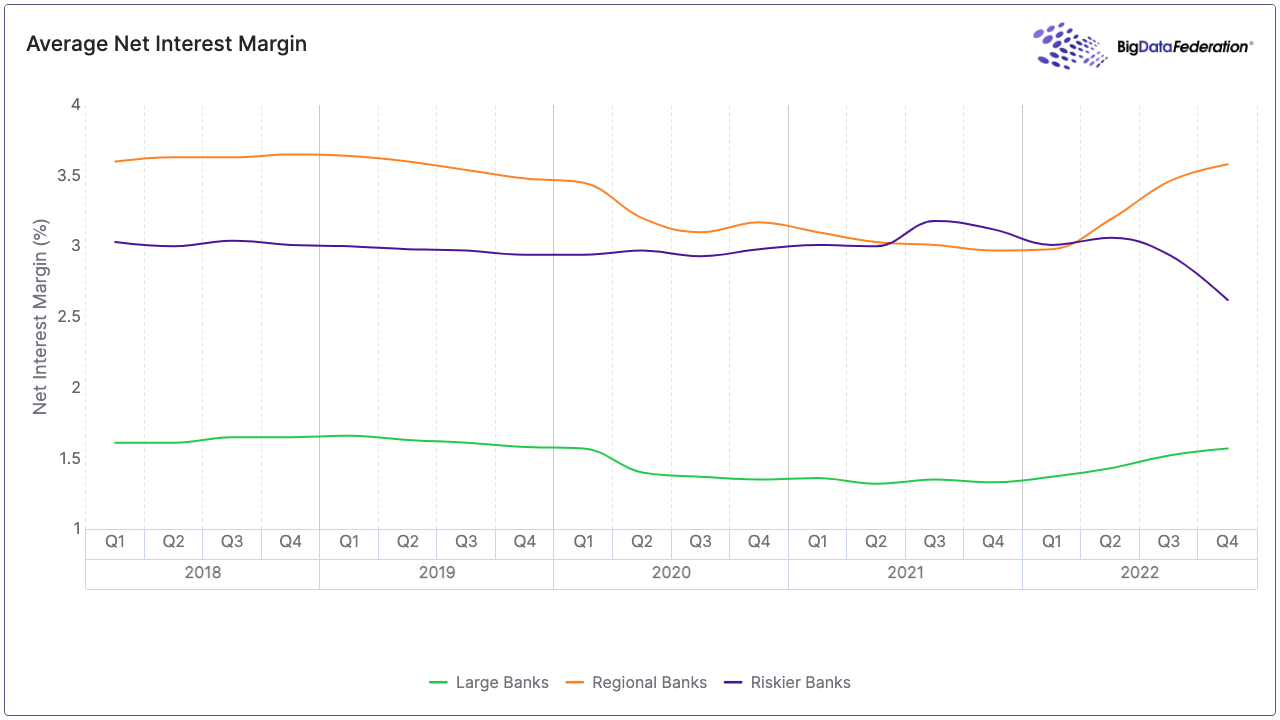
Our algorithms pinpointed a deteriorating net interest margin (NIM) as a leading indicator for trouble. A low NIM prevents banks from raising interest paid on deposits to potentially stanch the outward flow and reflects poorly managed assets. NIM increased at all the top thirty banks in the past year, except for Silicon Valley Bank, Signature Bank, and less than a handful of others.
In addition, other factors determined via pattern matching related to a diversion in fundamentals, particularly revenue and earnings, and accelerating deposit withdrawal. Our algorithms identified the following regional banks with metrics that closely matched Silicon Valley Bank and Signature Bank.
| Bank | Net Interest Margin | Deposits ($B) | Non-Confirming ($M) | Assets ($B) | Earning Assets ($B) | Earning Assets / Deposit |
| First Republic Bank (FRC) | 2.45% | 176.4 | 109.0 | 212.6 | 196.9 | 12% |
| First Foundation (FFWM) | 2.45% | 10.4 | 16.5 | 13.0 | 12.2 | 18% |
| HomeStreet Bank (HMST) | 2.53% | 7.5 | 11.9 | 9.4 | 8.9 | 19% |
| Customers Bank (CUBI) | 2.67% | 18.2 | 30.8 | 20.9 | 20.2 | 11% |
| Flushing Financial (FFIC) | 2.70% | 6.0 | 53.4 | 8.4 | 8.0 | 35% |
| Horizon Bancorp (HBNC) | 2.85% | 5.9 | 22.5 | 7.9 | 7.1 | 21% |
| Tompkins Financial (TMP) | 3.00% | 6.7 | 33.0 | 7.7 | 7.6 | 14% |
| Sandy Spring Bancorp (SASR) | 3.26% | 11.0 | 47.4 | 13.8 | 13.1 | 20% |
| Live Oak Bancshares (LOB) | 3.76% | 8.9 | 18.8 | 9.9 | 9.1 | 2% |
| Capitol Federal Financial (CFFN) | 1.61% | 6.1 | 8.4 | 9.9 | 11.4 | 87% |
Source: Big Data Federation, Inc.
The largest of which is First Republic Bank. During 4Q22, it had a net interest margin of 2.35%, down 35 basis points from 2Q22. First Republic Bank also has a regional and loan-type concentration akin to Silicon Valley Bank. Both have a heavy presence in the San Francisco Bay Area. Four-fifths of Silicon Valley Bank loans were Commercial & Industrial loans, while First Republic Bank holds a similar percentage of their loans as mortgages. All this leaves First Republic Bank vulnerable to a similar run as Silicon Valley Bank and Signature Bank. Overall, the riskier banks listed above have an unhealthy trend in the net interest margin, in addition to other issues.
As can be seen, the risk for the banking system to collapse is low because deposits are healthy, non-performing loans as a percent of the total remain low and stable, and earning assets are more than enough to cover deposits. Systematic risk will further be reduced once the Fed pauses rate hikes or pivots to rate cuts. While the systematic risk is low, even when considering potential miscalculations in judging asset values, regional banks are in a tougher spot, and we expect some casualties.
*Large banks: AXP, BAC, BK, C, COF, DFS, GS, JPM, MS, RJF, SCHW, SYF, USB, WFC
**Regional banks: ABCB, AMTB, ASB, AUB, BANC, BANF, BANR, BHLB, BKU, BMRC, BOH, BOKF, BPOP, BRKL, BUSE, BY, CAC, CADE, CASH, CATY, CBSH, CBU, CCB, CFB, CFG, CFR, CHCO, CMA, CNOB, COLB, CPF, CTBI, CUBI, CVBF, DCOM, EBC, EFSC, EGBN, EWBC, FBK, FBMS, FBNC, FBP, FCF, FCNCA, FFBC, FFIC, FFIN, FFWM, FHB, FHN, FIBK, FISI, FITB, FNB, FRC, FRME, FULT, GBCI, GSBC, HAFC, HBAN, HBNC, HFWA, HMST, HOMB, HONE, HOPE, HTBK, HTH, HTLF, HWC, IBCP, IBTX, INDB, KEY, LBAI, LKFN, LOB, MBWM, MCB, MSBI, MTB, NBHC, NBTB, NIC, NWBI, OBNK, OCFC, OFG, ONB, OSBC, OZK, PACW, PB, PEBO, PFBC, PFC, PGC, PNC, PNFP, PPBI, PRK, QCRH, RF, RNST, SASR, SBCF, SBNY, SBSI, SFBS, SFNC, SI, SIVB, SNV, SRCE, SSB, STBA, STEL, TBBK, TCBI, TCBK, TFC, TFIN, THFF, TMP, TOWN, TRMK, UBSI, UCBI, UMBF, UVSP, VBTX, VLY, WABC, WAFD, WAL, WASH, WBS, WSBC, WTFC, ZION, BSRR, CFFN, CVCY, CZFS, FMBH, GNTY, ORRF, SMBK
***Riskier banks: FFWM, FRC, HMST, CUBI, FFIC, HBNC, TMP, SASR, LOB, CFFN
Published by Big Data Federation · All insights · Subscribe to Insights