Macro Momentum Strategy: The Golden Cross
By Big Data Federation, Inc.

Investors chasing high-performing stocks can leverage momentum to outperform the market.
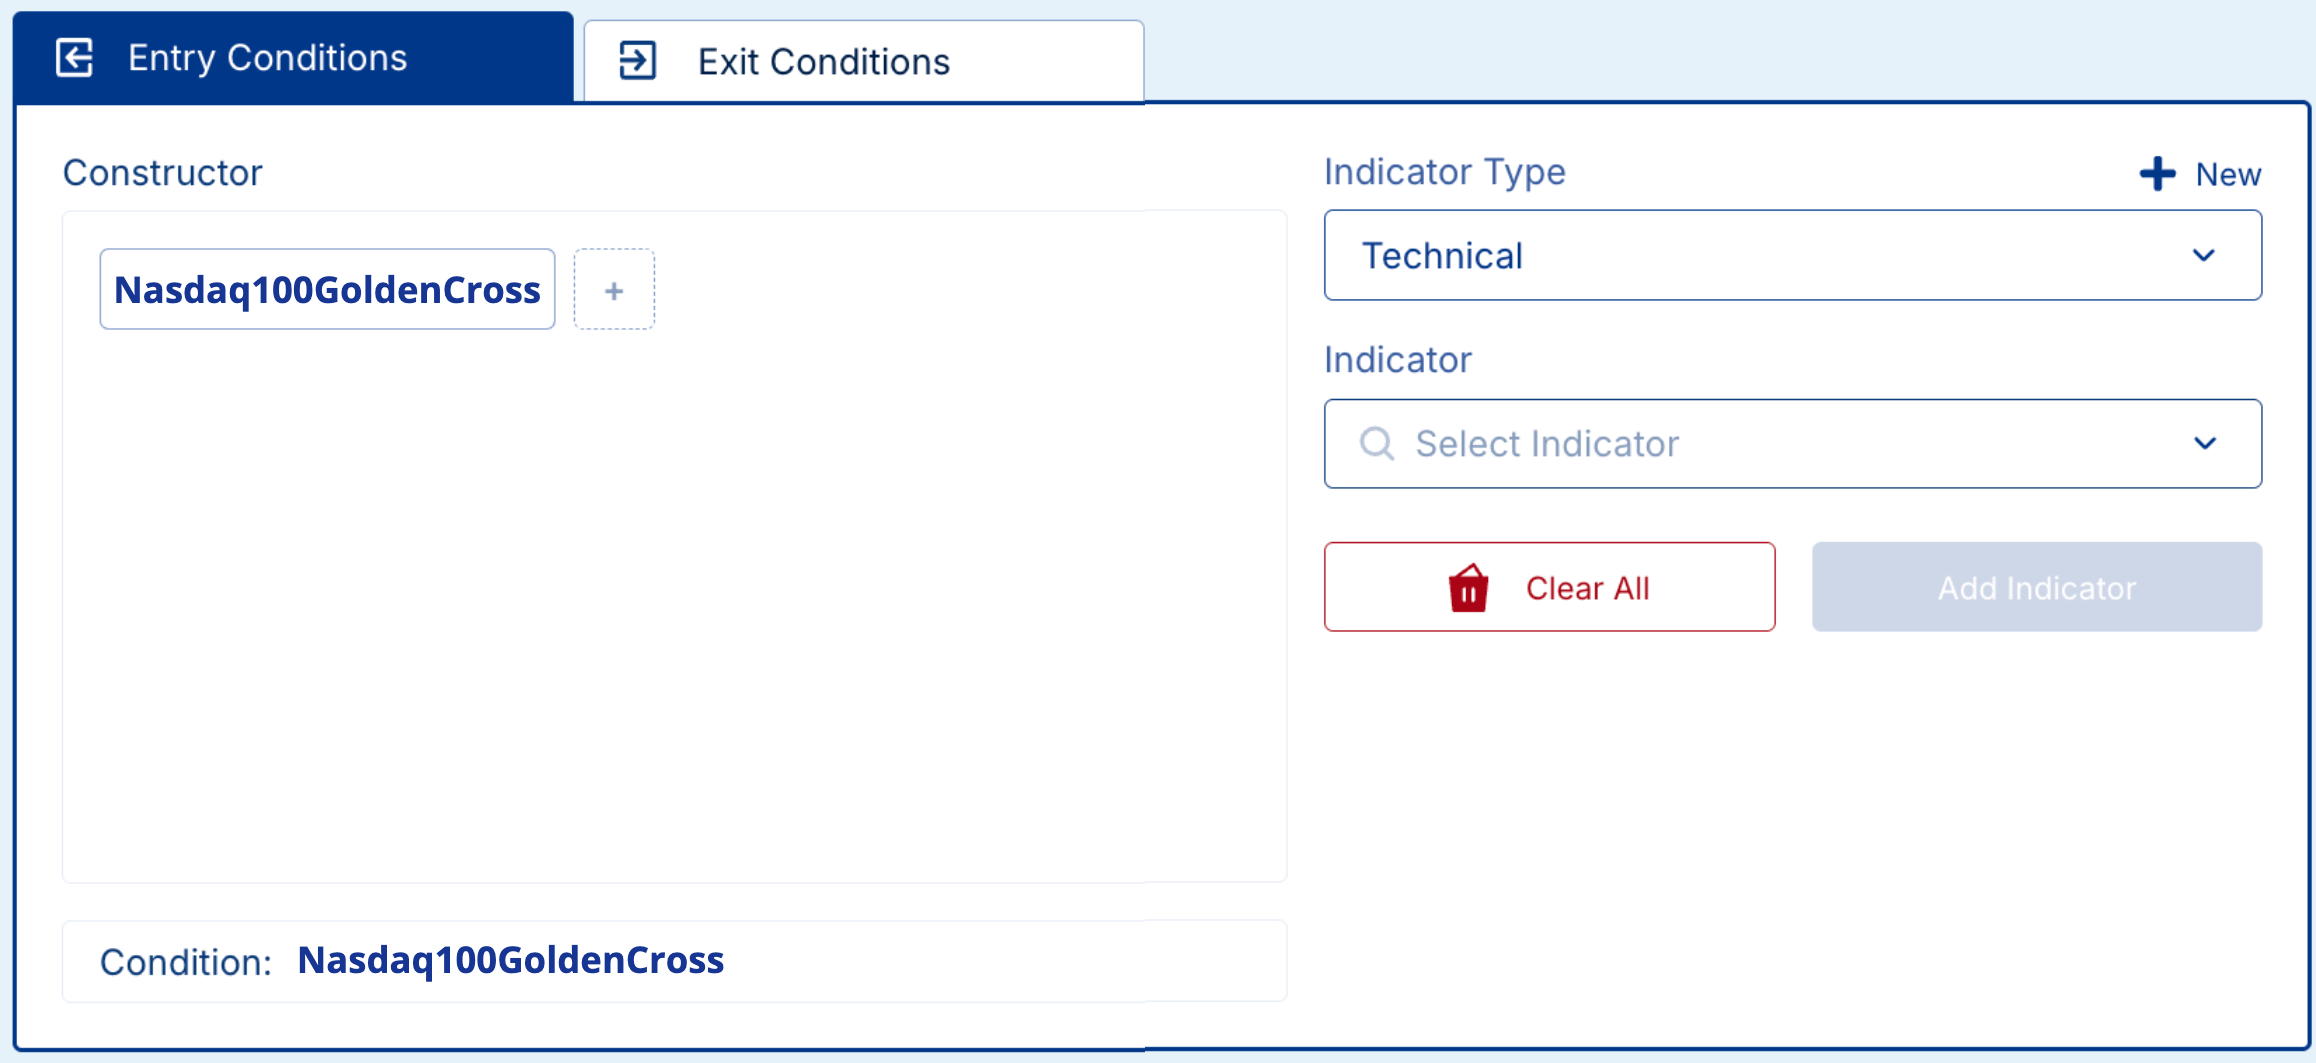
Here, we will build a macro momentum strategy using the Nasdaq 100 Index. We will focus on a well-known momentum indicator, the Golden Cross (GC). It is defined as when the short-term moving average, as measured by the 50-day, surpasses the long-term moving average, as measured by the 200-day. For our entry condition, we stipulate that the golden cross for the Nasdaq 100 Index is true. We do not specify an exit condition, which means that we will exit our position when the golden cross for the Nasdaq 100 index is false. With OdinUltra, we can quickly develop and evaluate this strategy, backed by precise data analytics.
 |
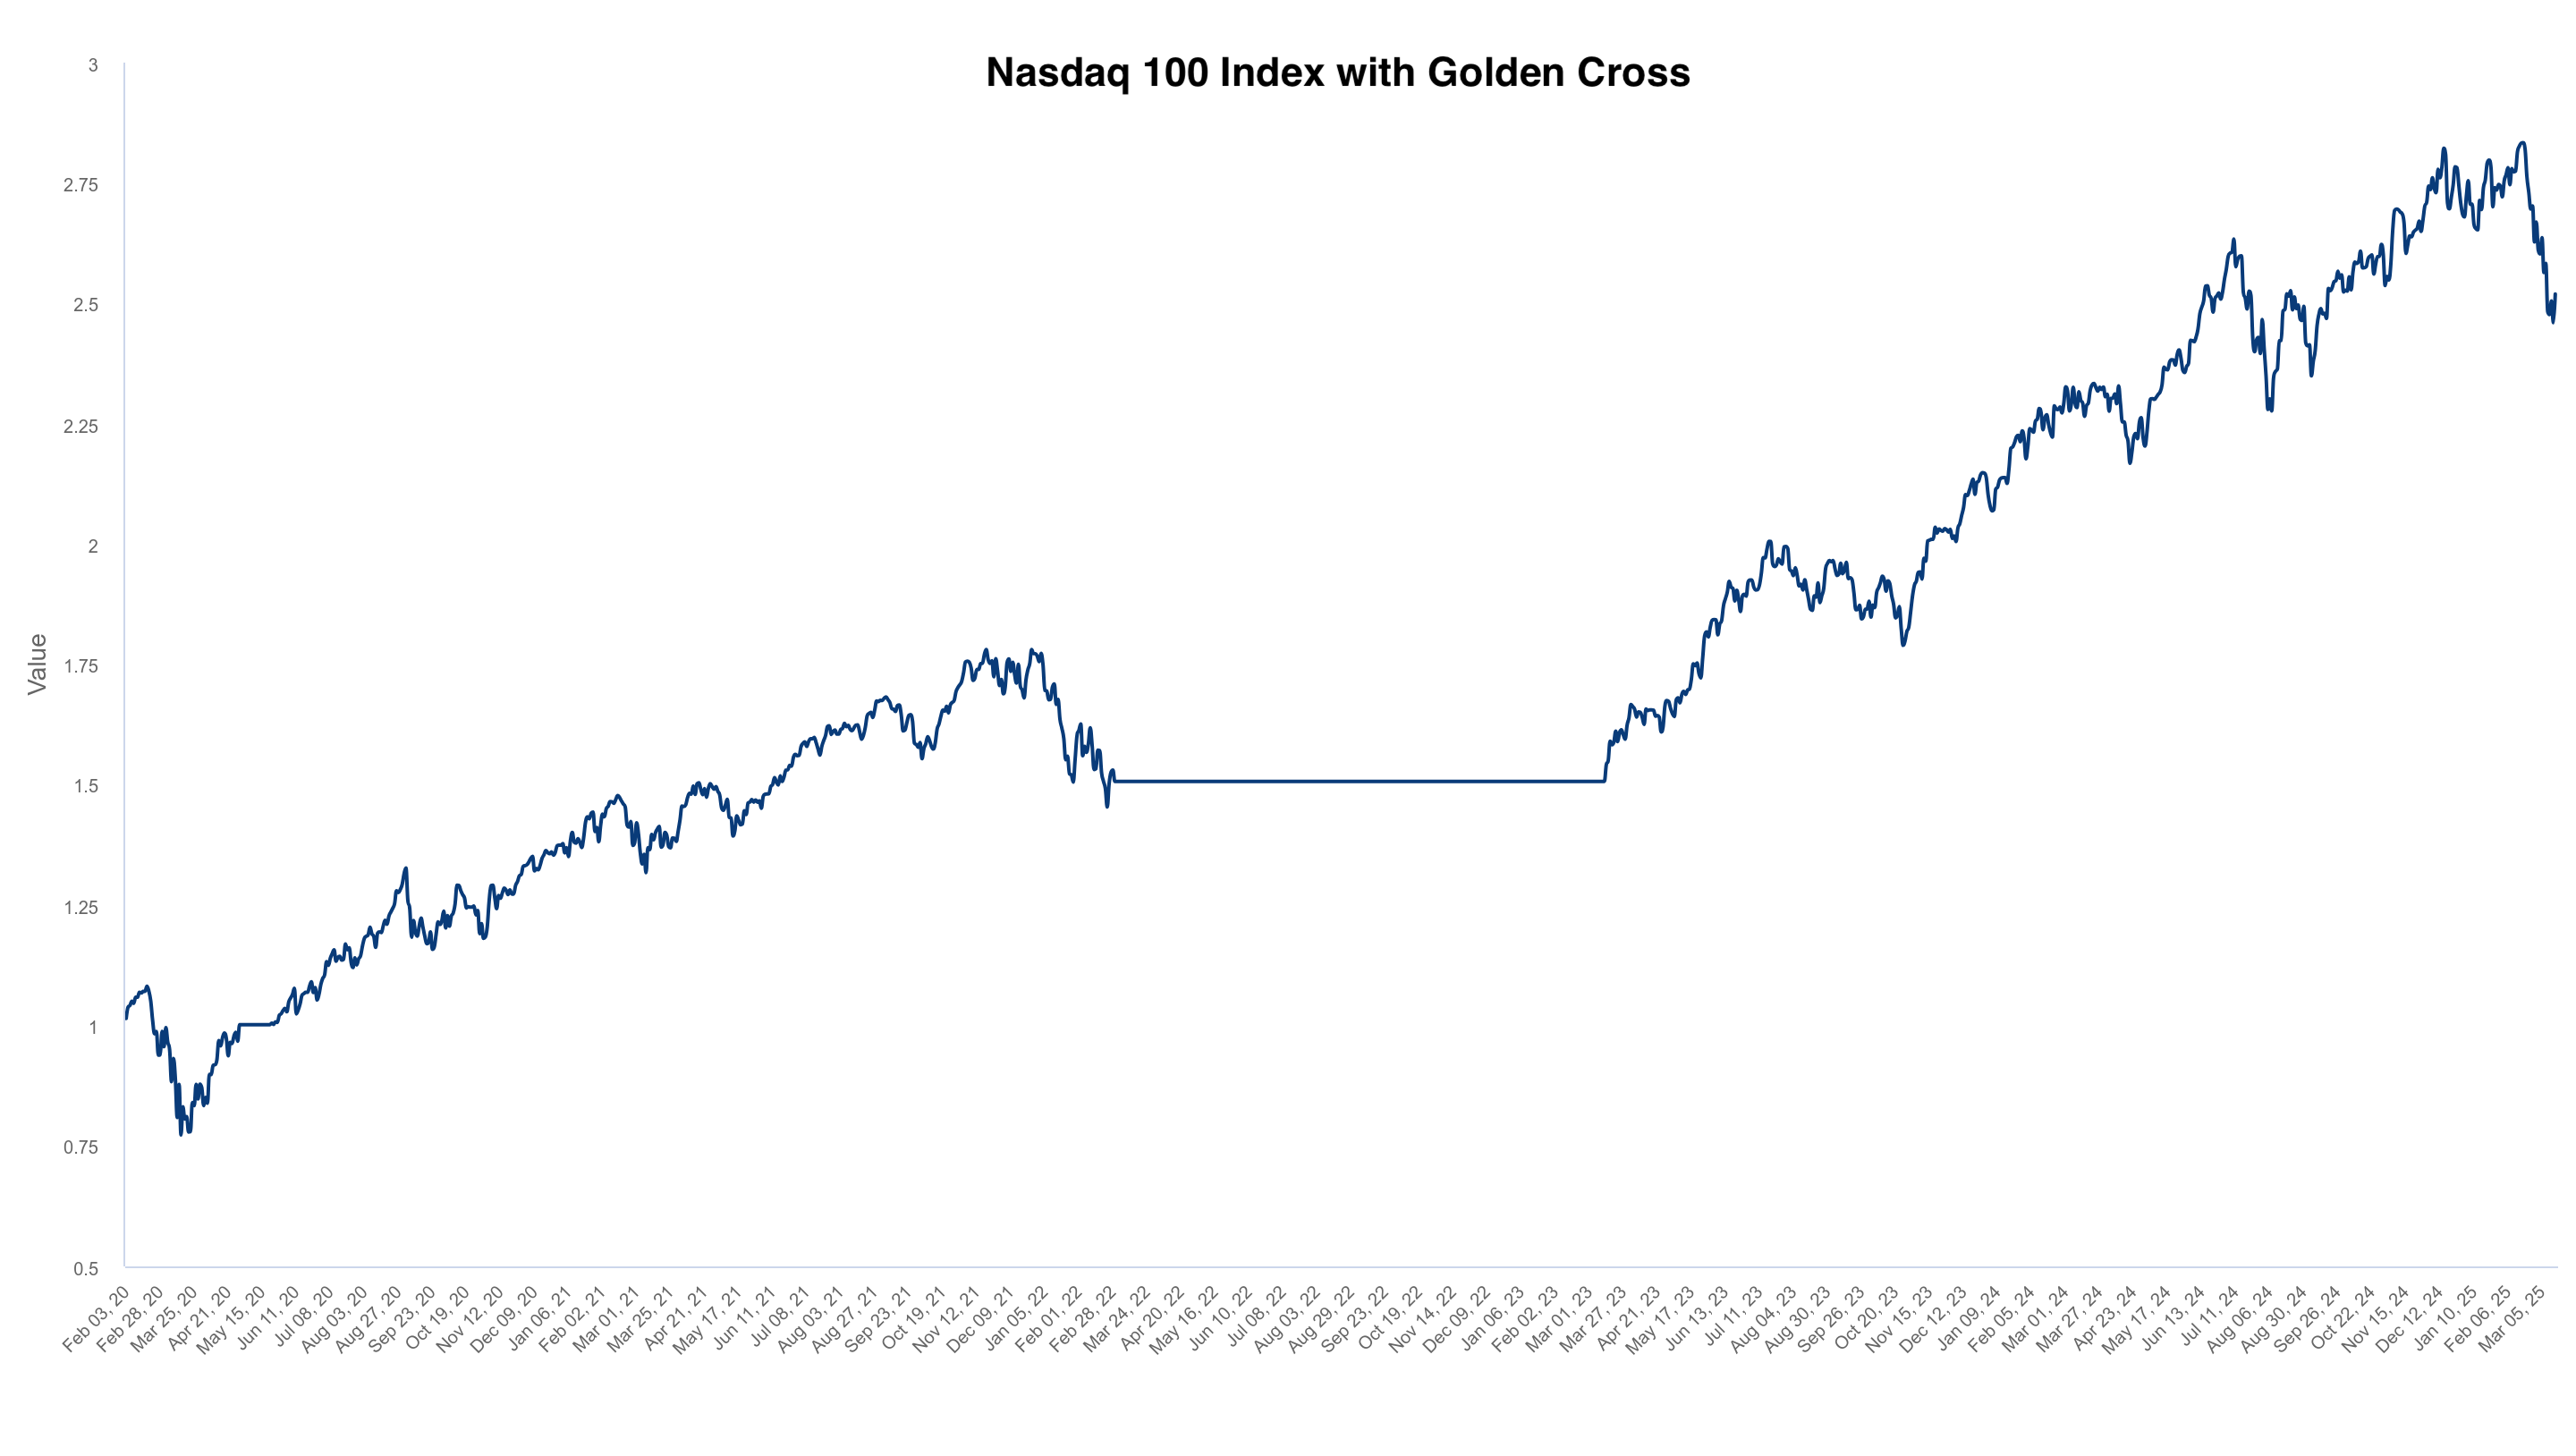 |
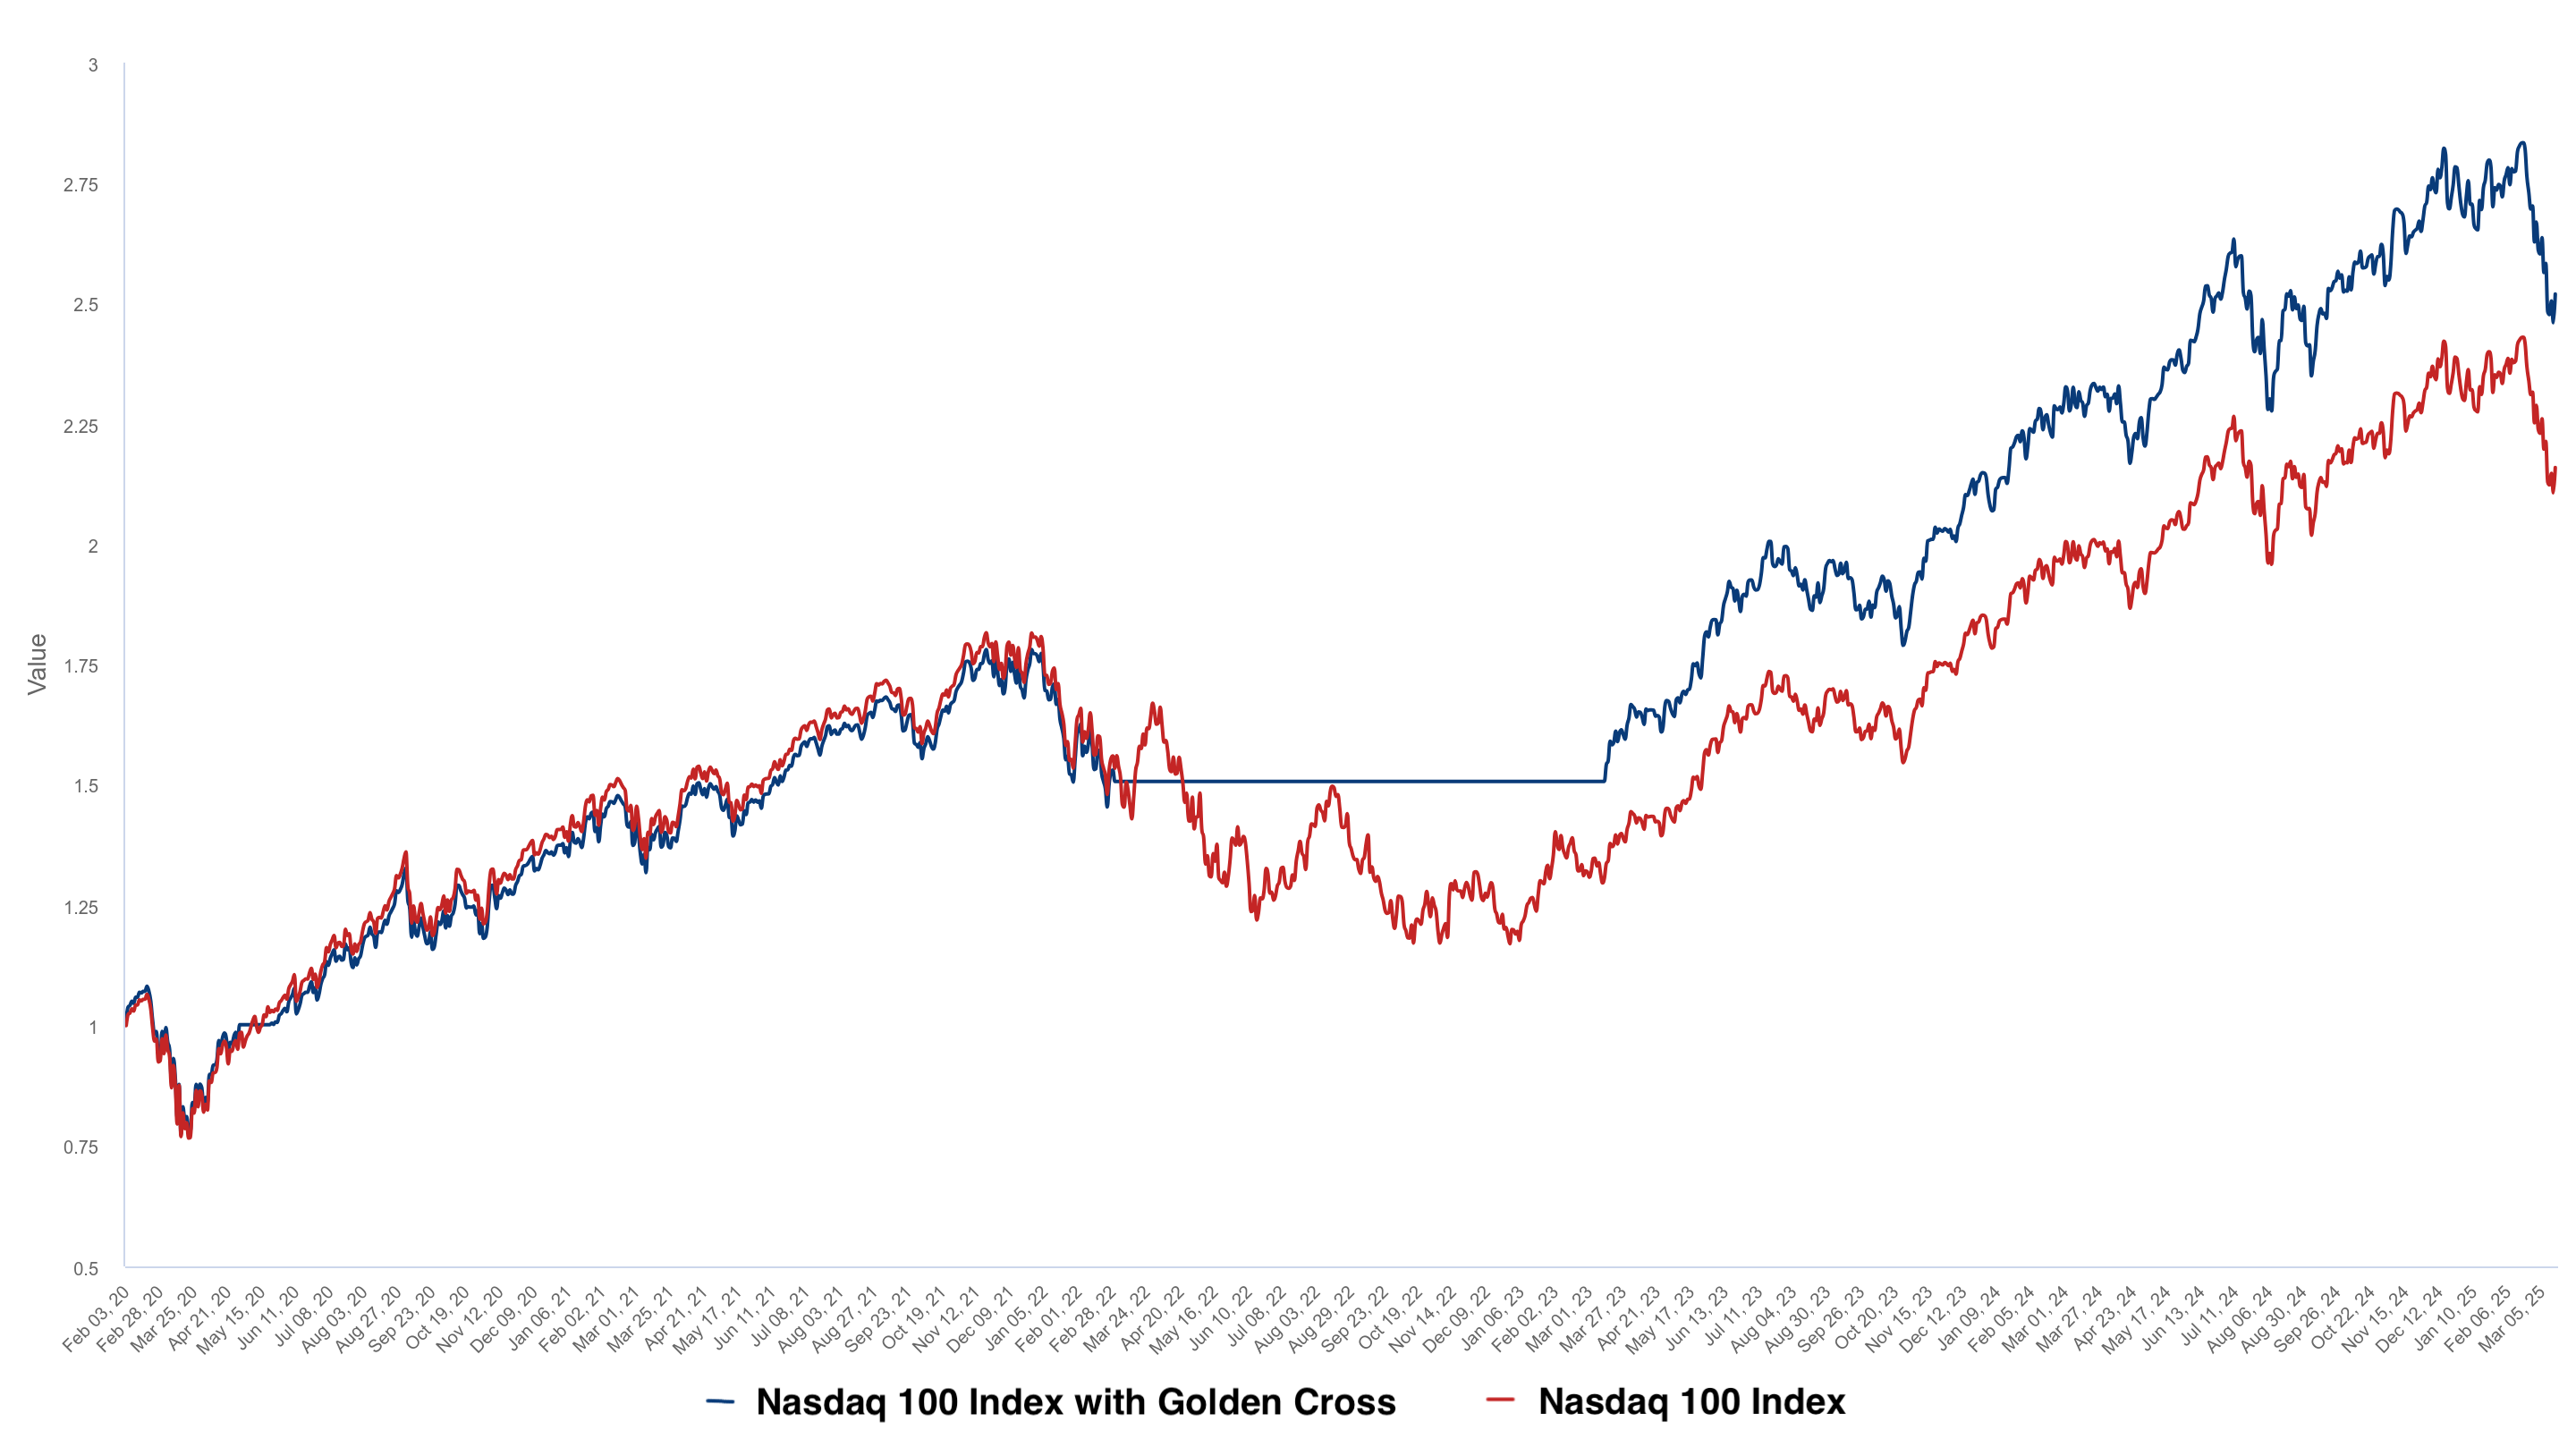
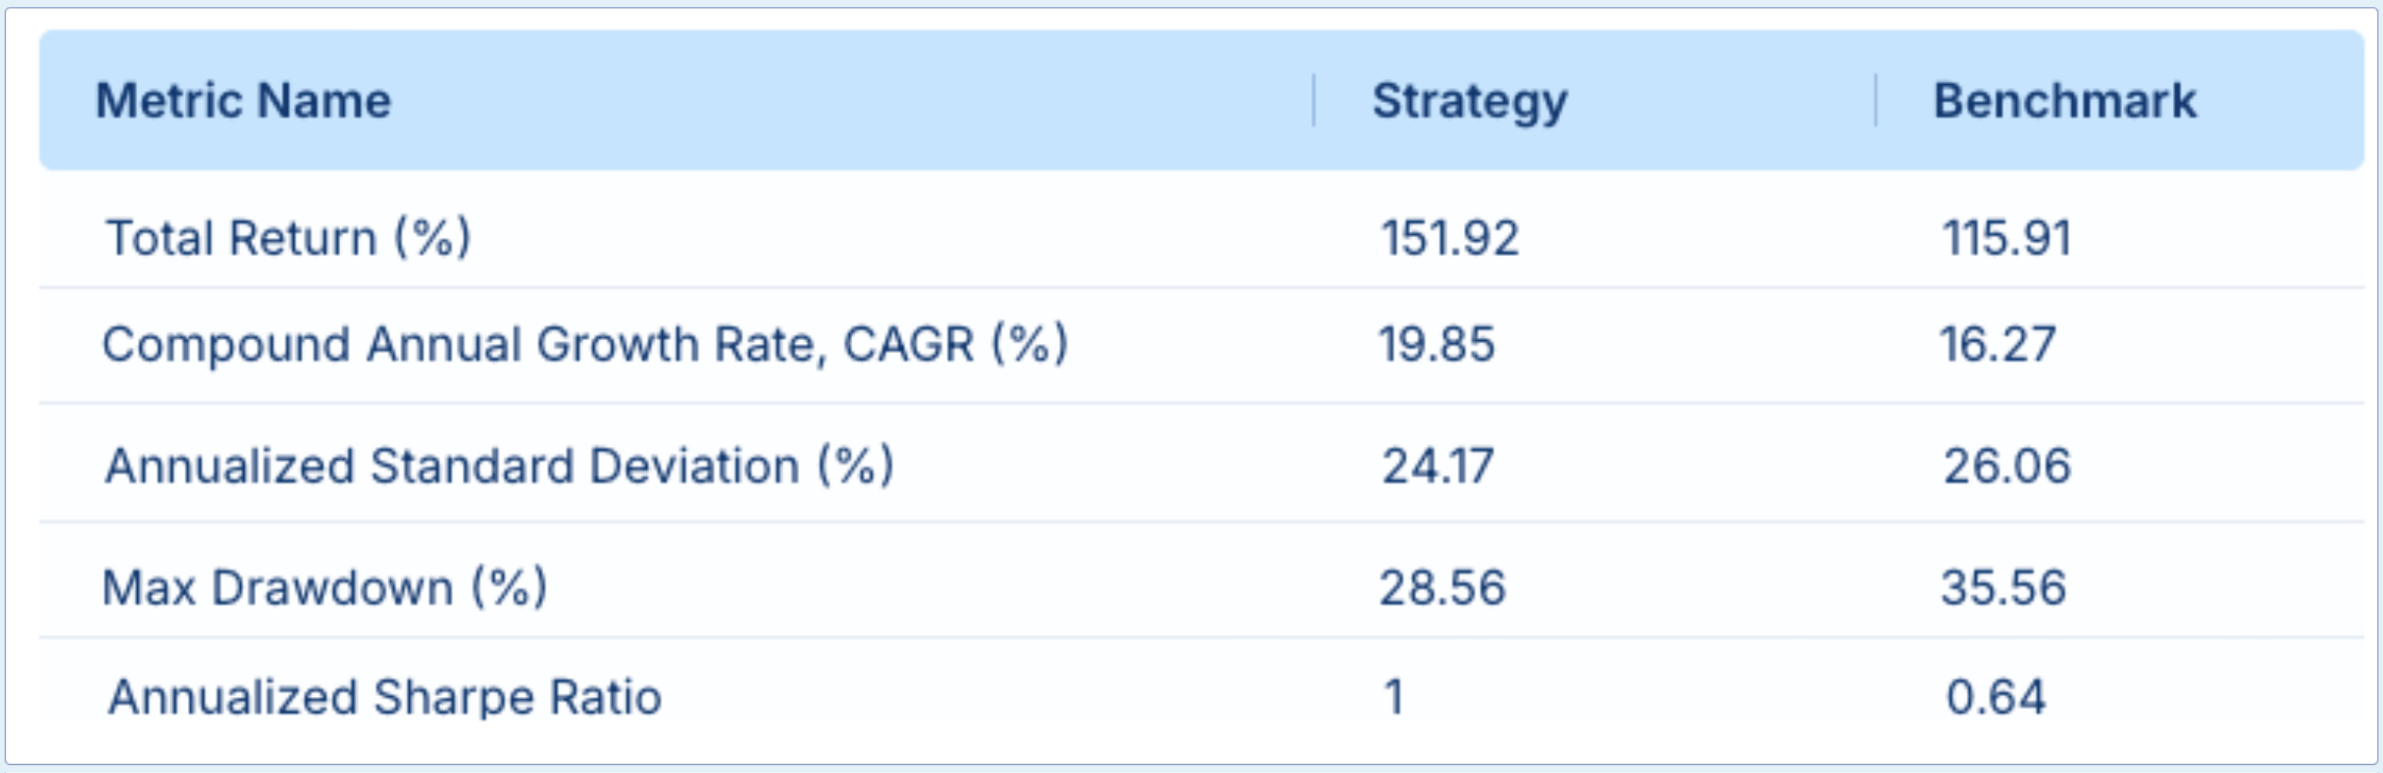
Next, we compare the five-year performance of our strategy against the Nasdaq 100 Index benchmark – essentially, just holding the Nasdaq 100 Index. As shown in the chart below, our strategy outperforms the Nasdaq 100 Index. Moreover, OdinUltra simultaneously calculates key performance measures for our strategy (Nasdaq 100 Index w/ GC) and the benchmark (Nasdaq 100 Index). In the following table, we compare various return, risk, and risk-return metrics. It highlights that our strategy reduced risk, in terms of max drawdown, while maintaining comparable returns. Furthermore, the inclusion of the golden cross indicator boosted the Sharpe Ratio to 1.
 |
 |
Investors can instantly download historical positions to test and download live positions to deploy. Ultimately, OdinUltra can be used to systematically hypothesize, construct, verify, and execute strategies using complex logics across asset classes to improve risk-return characteristics.
To learn more, contact us at strategy@odinultra.ai.
Published by Big Data Federation · All insights · Subscribe to Insights