Fed Actions Ripple Across Housing Market
By Big Data Federation, Inc.

-
Sale-to-list price ratio dropped below one for the first time since March 2021
-
Homebuilders reported offering incentives to improve sales and limit cancellations
-
Rents remain significantly elevated compared to prior years and propped up inflation
Rising mortgage rates have calmed the frenzied activity within the housing market. For existing homes, the sale-to-list price ratio dropped below one for the first time since March 2021, indicating homes are selling for less than the list price (-1% MoM/ -2% YoY/ 2% YoY3). For new homes, builders’ confidence fell as buyer traffic dwindled and sales expectations for the next six months deteriorated (-11% MoM/ -35% YoY/ -27% YoY3). More than half reported offering incentives to improve sales and limit cancellations, including mortgage rate buydowns, free amenities, and price reductions.
|
Data (August) |
MoM |
YoY |
YoY31 |
|
Sale-to-List Price Ratio |
-1% |
-2% |
2% |
|
Homebuilders Confidence Index |
-11% |
-35% |
-27% |
|
Rents |
0% |
10% |
23% |
|
Vacancy Index |
2% |
19% |
-20% |
Source: Big Data Federation, Inc.
Unsurprisingly, the combination of higher rates and prices caused average monthly payments for a mortgage, based on a 5% down payment and 30-year fixed-rate mortgage (FRM), to exceed rent. As housing affordability lowered dramatically, many would-be first-time home buyers were forced into the rental market. Rents plateaued (0% MoM) after months of aggressive climbs, helped by slight relief on the supply side. Vacancies climbed (2% MoM/ 19% YoY) but are far off from pre-pandemic levels (-20% YoY3).
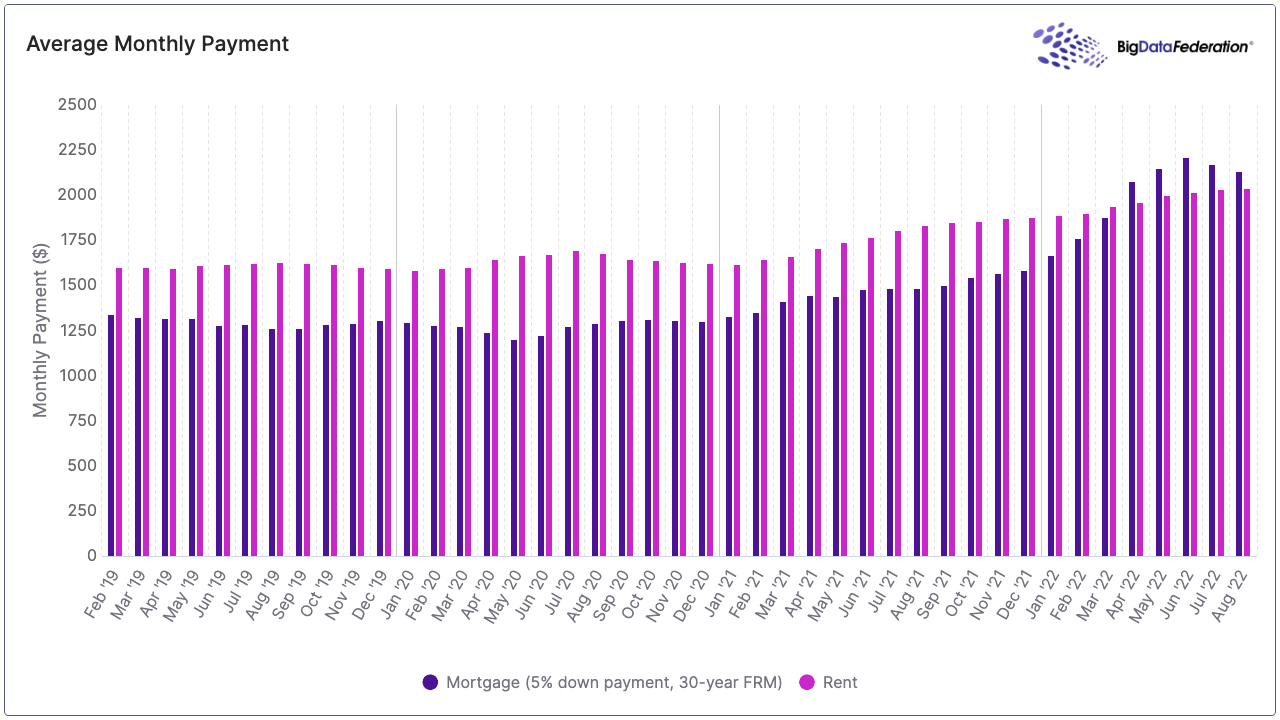
More notably, rents remain significantly elevated compared to prior years (10% YoY / 23% YoY3) and propped up inflation while other sources eased. Accounting for roughly one-third of the Consumer Price Index (CPI), year-over-year changes heavily contribute to inflation. Seasonal trends indicate rents should cool with the temperatures in the fall and winter; however, it may take time to translate into CPI.
1 YoY3 = compared to August 2019
Published by Big Data Federation · All insights · Subscribe to Insights