Which Momentum Indicator Works Better?
By Big Data Federation, Inc.

A value-momentum strategy blends two historically rewarded factors: buying relatively cheap stocks (value) while also tilting toward stocks with strong recent performance (momentum). The momentum signal is defined by a lookback window, and that choice matters because it determines how quickly the strategy responds to changing trends. The most common academic and practitioner default is the 12–1 measure, roughly the past 12 months of returns excluding the most recent month, though many implementations also test shorter windows such as 6 months.
Inside a value-momentum framework, the comparison between 12-1 momentum and 6-month momentum is largely a tradeoff between stability and responsiveness. A 6-month indicator is more “tactical”: it tends to rotate into new winners faster and exits weakening names sooner. Over a longer holding period, such as 10 years, when market leadership shifts frequently through changing factor regimes, rapid sector rotations, or sharp reversals, that faster reaction can help the value-momentum portfolio stay aligned with what’s working now rather than what worked over a longer trailing window.
Using thefinancial.ai, we ran a 10-year backtest from February 19, 2016, to February 19, 2026, with point in time data, comparing two versions of the same value-momentum process. Strategy 1 selects the 200 lowest price-to-book stocks in the S&P 500 and then ranks the top 100 by 12–1 month momentum. Strategy 2 applies the same value screen but ranks the top 100 by 6-month momentum.

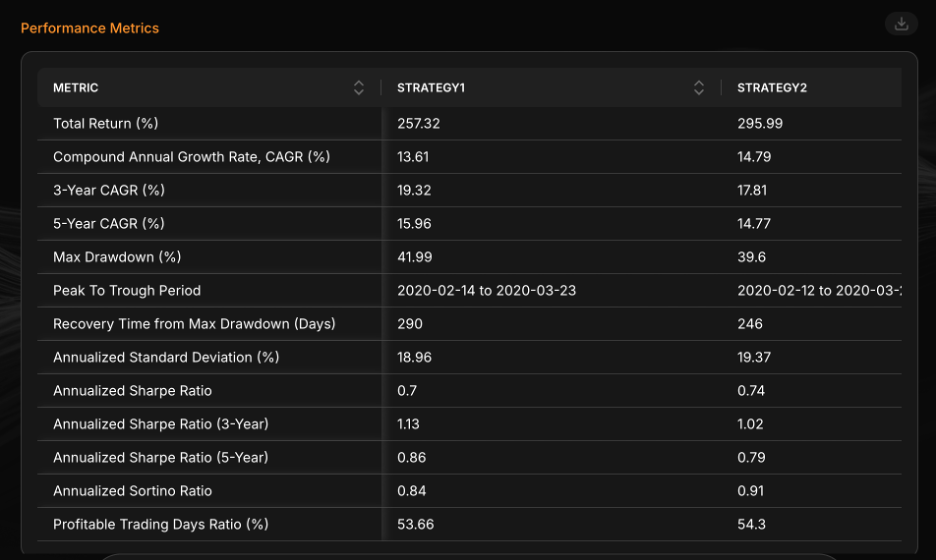
The results are clear in both the equity curve and the performance table. Strategy 2, using 6-month momentum, delivered higher total returns of 295.99% versus 257.32% and a stronger overall CAGR of 14.79% versus 13.61%. It also demonstrated slightly better risk resilience, with a lower maximum drawdown of 39.6% versus 41.99%, and a faster recovery time.
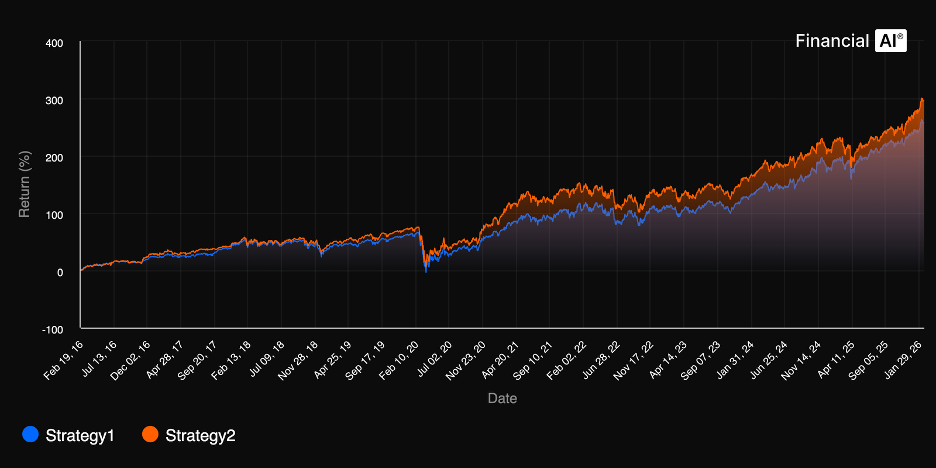
Strategy 1 did post stronger recent risk-adjusted returns, with higher 3-year and 5-year Sharpe ratios. However, over the full 10-year period, the more tactical 6-month approach (Strategy 2) captured shifting leadership more effectively. In a market marked by faster rotations and sharper reversals, responsiveness outweighed the added stability of the longer lookback.
Published by Big Data Federation · All insights · Subscribe to Insights