Washington vs Wall Street
By Big Data Federation, Inc.

As the U.S. presidential election approaches, investors are positioning their portfolios accordingly. Here, we present our unbiased, factual analysis of past market behaviors under different administrations and Congress.
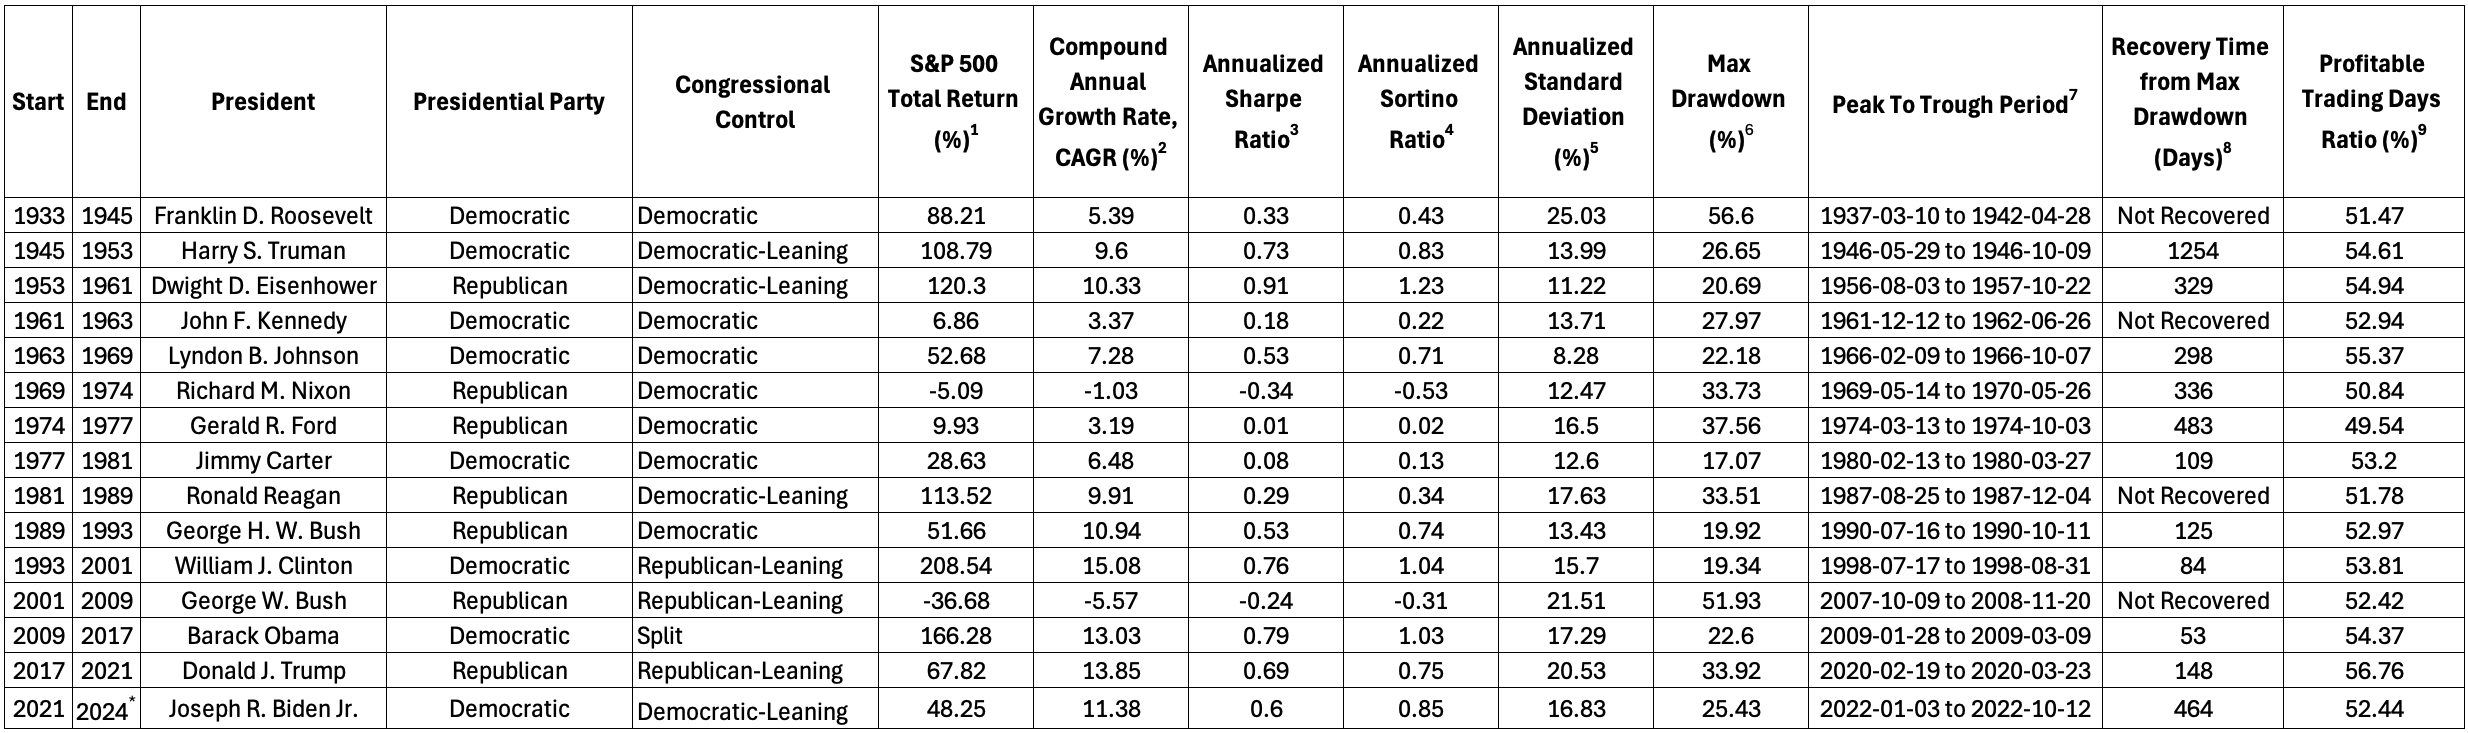
In the table below, we present a detailed analysis of various market performance metrics under different U.S. presidential administrations from Franklin D. Roosevelt to Joseph R. Biden Jr., including whether congressional control was Democratic, Republican, or split. Each metric’s definition can be found in the footnotes. We classified congressional control as Democratic, Democratic-leaning, Republican, Republican-leaning, or Split based on the congressional elections which occur every two years. Our calculations are based on the Inauguration Day to capture the full impact of each administration, as the outgoing president retains legal authority to make decisions, sign executive orders, and enact policies until the new president is sworn in on January 20.
After evaluating the presidential terms individually, we aggregated the results to reframe the question in terms of unified and divided government, resulting in four distinct scenarios: Unified Democrats, Unified Republicans, Divided with Democratic Presidents, and Divided with Republican Presidents. Unified Democrats or Unified Republicans occur when the respective party controls the presidency, Senate, and House. Divided with Democratic Presidents refers to periods when a Democratic president faces a split or opposing Congress, while Divided with Republican Presidents describes when a Republican president governs with a split or opposing Congress.
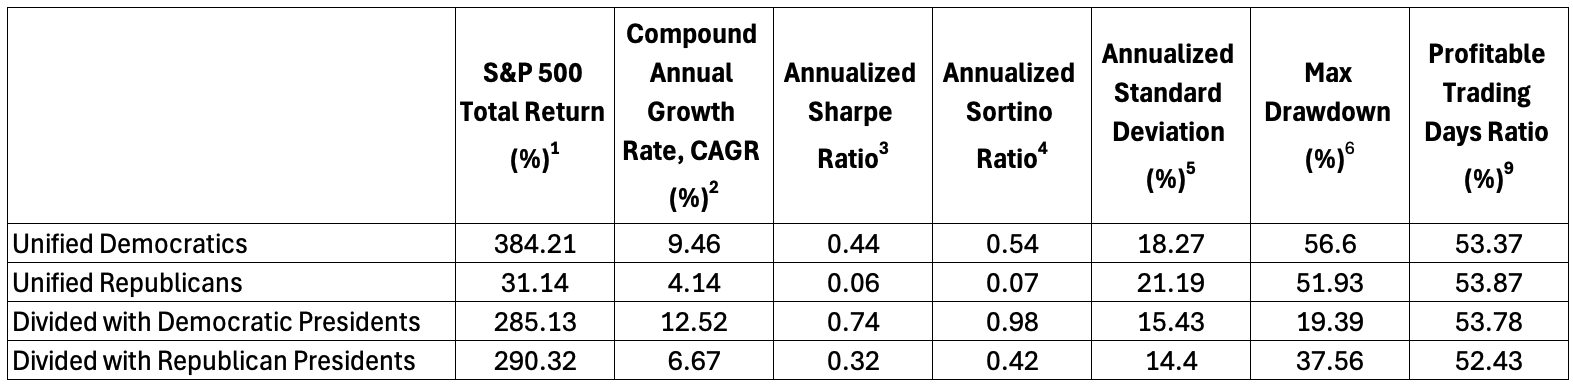
Our examination reveals that, in terms of both total return and annualized return, market performance tends to be more favorable under Democratic presidents, with Unified Democrats delivering the highest total return of 384.21% and Divided with Democratic Presidents showing the strongest Compound Annual Growth Rate (CAGR) of 12.52%. Risk-adjusted returns, measured by the Sharpe and Sortino ratios, are also highest under Divided with Democratic Presidents. Volatility, as indicated by the annualized standard deviation, peaks with Unified Republicans. Notably, scenarios with a divided Congress, regardless of whether the president is Democratic or Republican, result in lower drawdowns. Lastly, the profitable trading days ratio remains fairly consistent across all scenarios.
Market price action around elections should not be viewed in isolation as the primary driver; it is influenced by a complex web of interconnected macro and microeconomic factors. Historically, markets have performed best with the least volatility under a divided government with a Democratic president. While this trend is evident from past data, it’s important to remember that many other factors, such as monetary policies, corporate earnings, valuations, business cycles, global policies, and geopolitics, play significant roles. Additionally, it's worth noting that the current term is still ongoing.
*As of September 17, 2024
1S&P 500 Total Return (%): Total return in the simulation period.
2Compound Annual Growth Rate, CAGR (%): Mean annual growth rate for the 5-year, 3-year, or the whole backtest period.
3Annualized Sharpe Ratio: Annualized Sharpe ratio for the 5-year, 3-year, or the whole backtest period. 13-week treasury bill values are used as risk-free rates¹.
4Annualized Sortino Ratio: Annualized Sortino ratio, 13-week treasury bill values are used as risk-free rates¹.
5Annualized Standard Deviation (%): √252² * Standard deviation of trading day returns.
6Max Drawdown (%): Maximum drop in the whole backtest period. It is an indicator of downside risk.
7Peak To Trough Period: Period when max drawdown happened.
8Recovery Time from Max Drawdown (Days): How many days it took to recover from the largest drop.
9Profitable Trading Days Ratio (%): Daily hit rate of the strategy.
Published by Big Data Federation · All insights · Subscribe to Insights