No Smooth Sailing Ahead for GDP
By Big Data Federation, Inc.
While quarter-over-quarter (QoQ) economic growth trends have historically fluctuated, the magnitudes in 2021 were atypical; this rollercoaster was largely driven by considerable goods demand and heavy investment, particularly inventory investment. The black swan1 nature of the pandemic means we cannot rely solely on machine-learning algorithms to predict the recovery path. To map the forward trajectory, we use near-time company and industry data to generate a deeper understanding of the shifts occurring in the economy. Our analysis indicates economic fluctuations will likely continue into 2022 with GDP growth slowing in the first quarter and rallying in the following quarter.
2021 recap
In the first half of 2021, economic expansion was primarily driven by goods consumption as COVID restrictions reoriented spending away from services. Consumers, flush with cash, induced an epic sell-off of inventories to accommodate this increased demand. In 1Q21 and 2Q21, QoQ GDP growth registered 6.4% and 6.7%, respectively. In 3Q21, economic growth swung dramatically lower (2.3% QoQ) as COVID cases declined, leading to a substantial cooling of goods consumption and a not-so-impressive recovery in demand for services. In 4Q21, economic growth bounced back (6.9% QoQ) – mainly powered by substantial inventory investment, previously held back by supply-chain issues. For context, if the high level of inventory investment had not occurred, growth would have been 1.6%. Moderate consumer spending for both goods and services, combined with improvements in the trade balance from higher exports of crude oil, natural gas, metals, and food products also contributed to growth.
A new year and an economy in transition
4Q21 was a hard act to follow. For 1Q22, we estimate QoQ GDP growth in the low single digits (1-2%). Inventory growth calmed to a more moderate pace. Demand for goods continued to cool lowering prices and volume. And people returned to services to spend their money.
Inflation-adjusted retail sales excluding food and gas2 fell -0.5% month-over-month (MoM) in February and -0.4% MoM in March. The latest Consumer Price Index (CPI) release revealed that prices for goods, excluding food and energy, decreased -0.4% MoM in March, the first decline since February 2021. These trends are most evident in the car market. Slackened demand for used cars resulted in negative price growth (-0.7% MoM) in March; prices have risen in April but this reflects seasonal buying patterns and not a secular increase in demand.
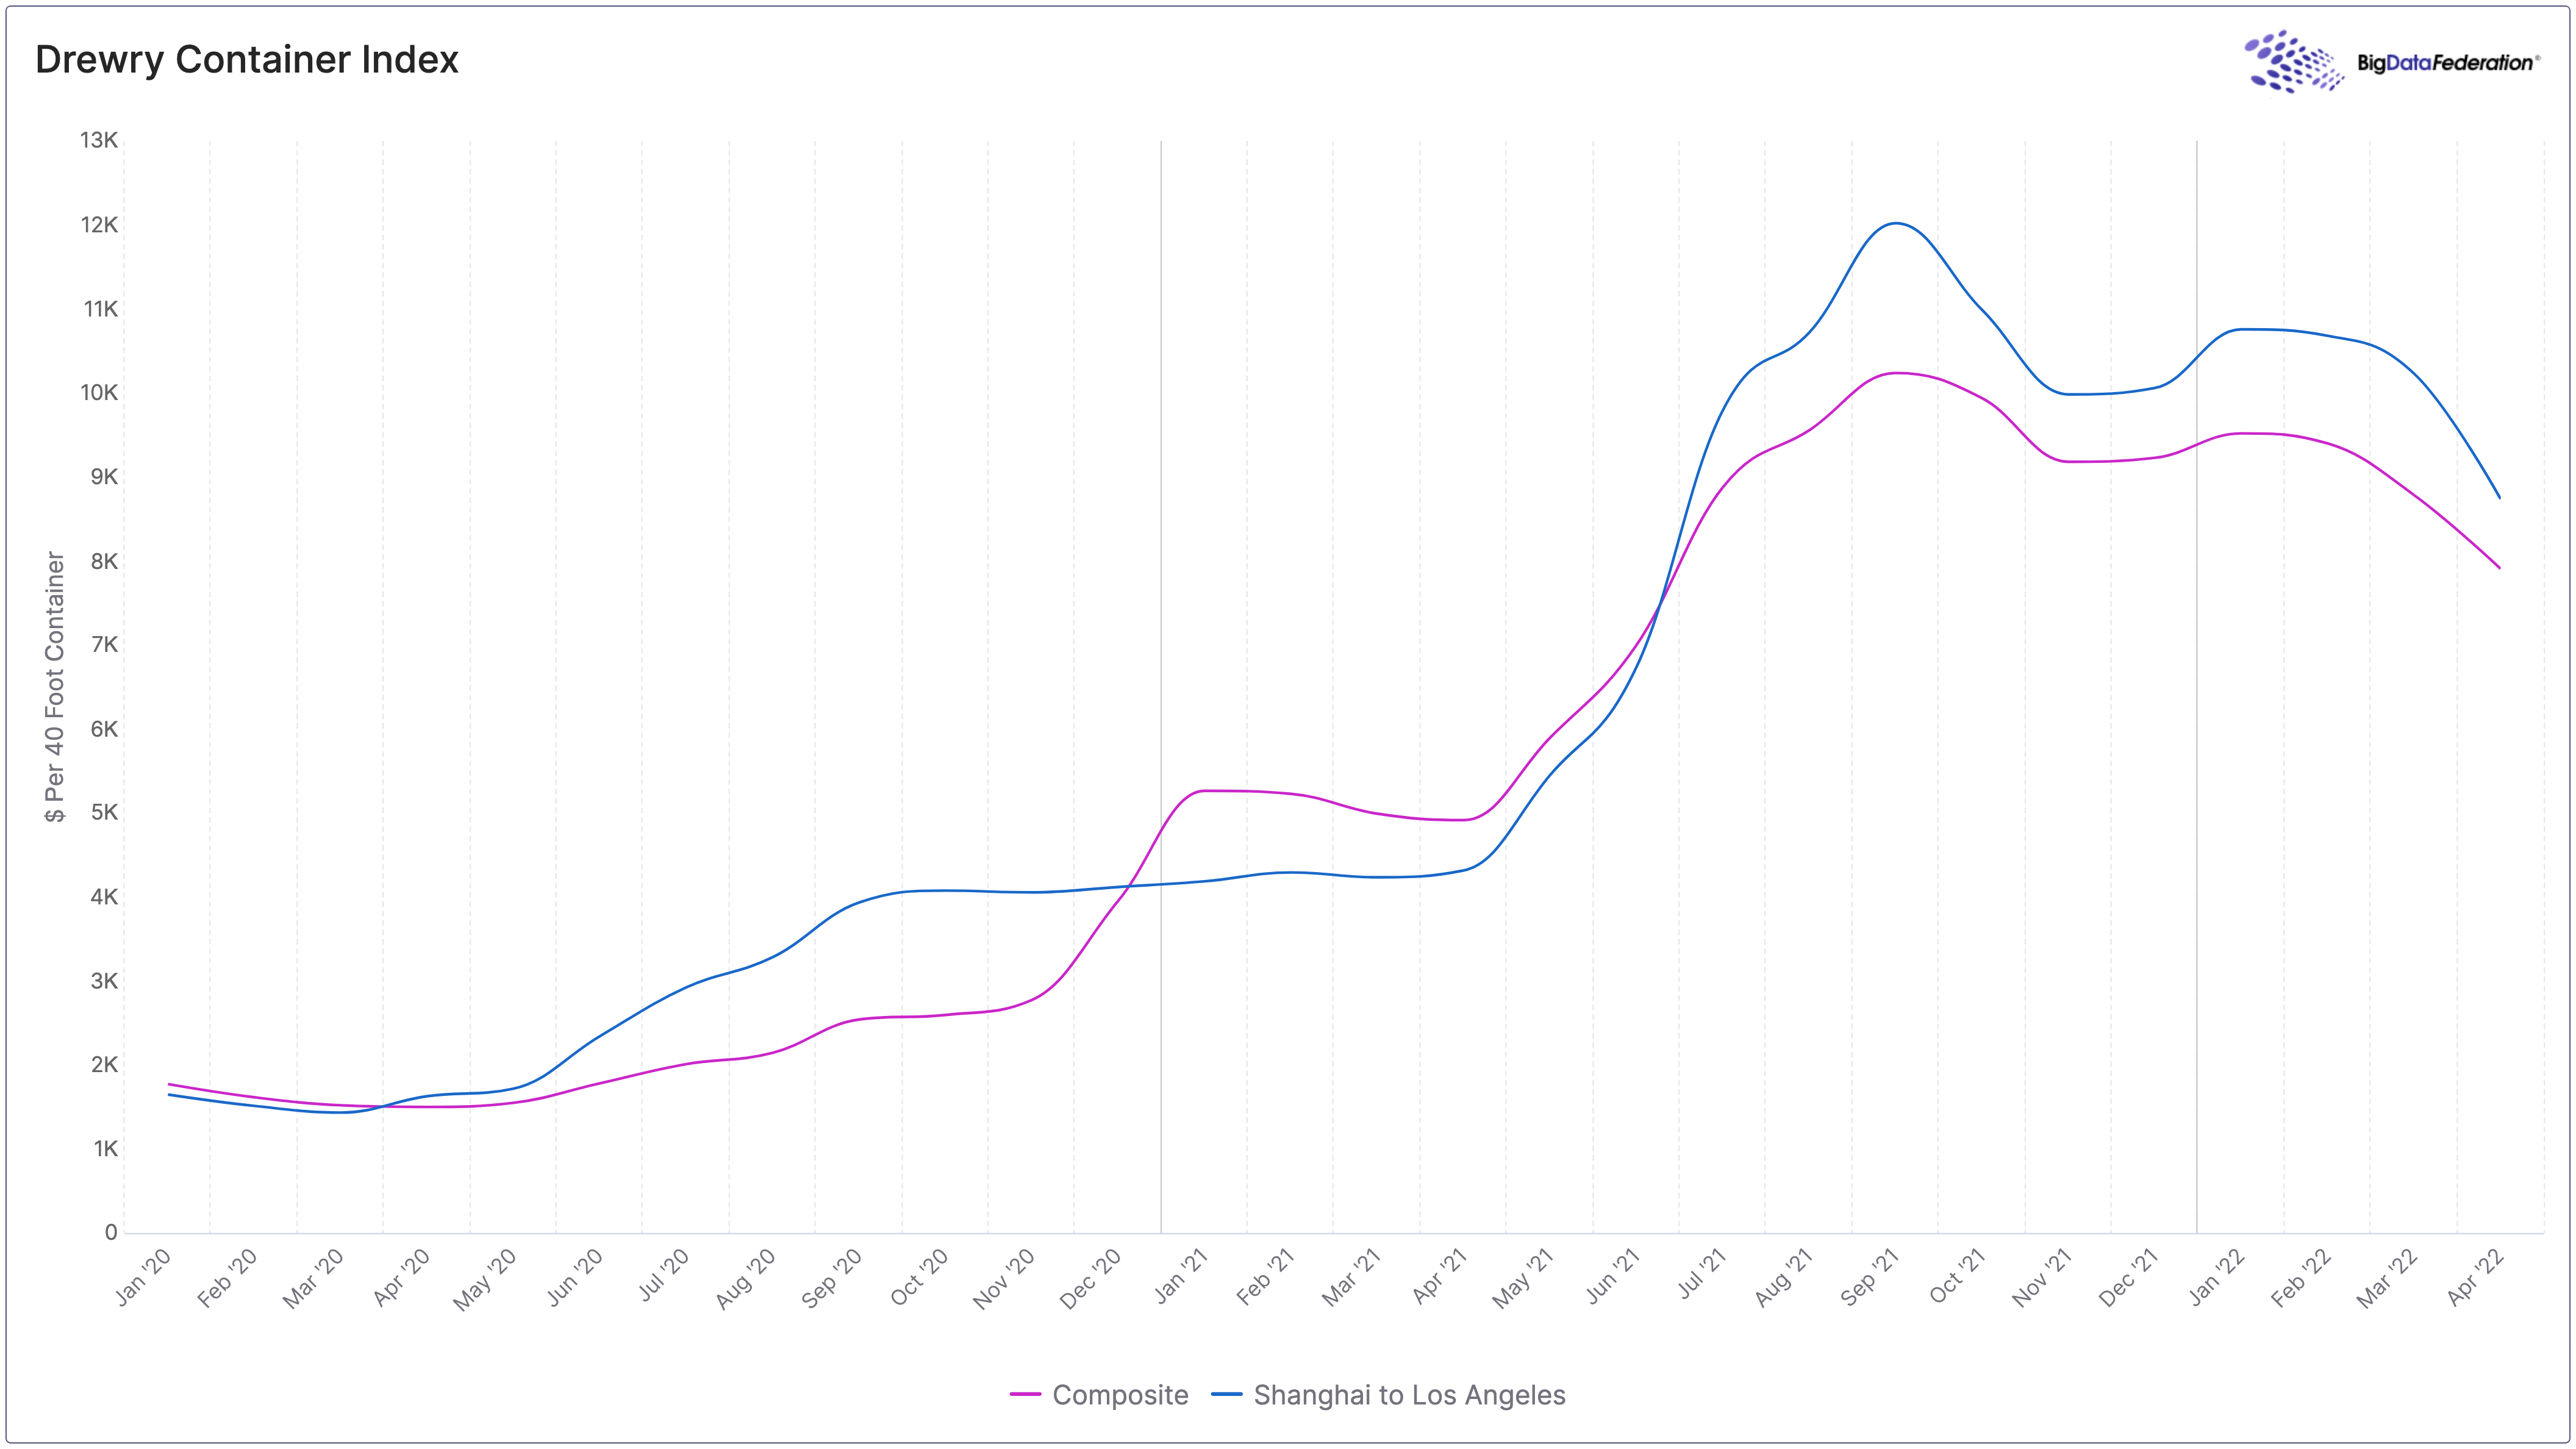
The weakened demand for goods led to a drop in shipping and trucking rates. The composite Drewry World Container Index, representing spot container freight rates for major trade routes, has steadily declined since late February (-15%). In parallel, trucking spot rates for both dry-van and refrigerated trucks – which carry non-perishable and perishable household goods – fell by -17% and -20%, respectively from peaks at the end of 2021. While this could reflect an increased supply of trucks, diminished demand for this type of trucking seems more likely. Flatbed spot rates, which transport heavier items like capital goods headed for businesses and construction, increased 1.7% during the same period.
While consumer goods suffered, the much anticipated return to services consumption picked up speed as the Omicron wave subsided. The surge in both prices and volume that are overriding seasonal fluctuations clearly signals a release of pent-up services demand. The most recent CPI report showed the cost of services less energy grew at its fastest rate in almost 30 years; the seasonally adjusted index increased +0.6% MoM in March.
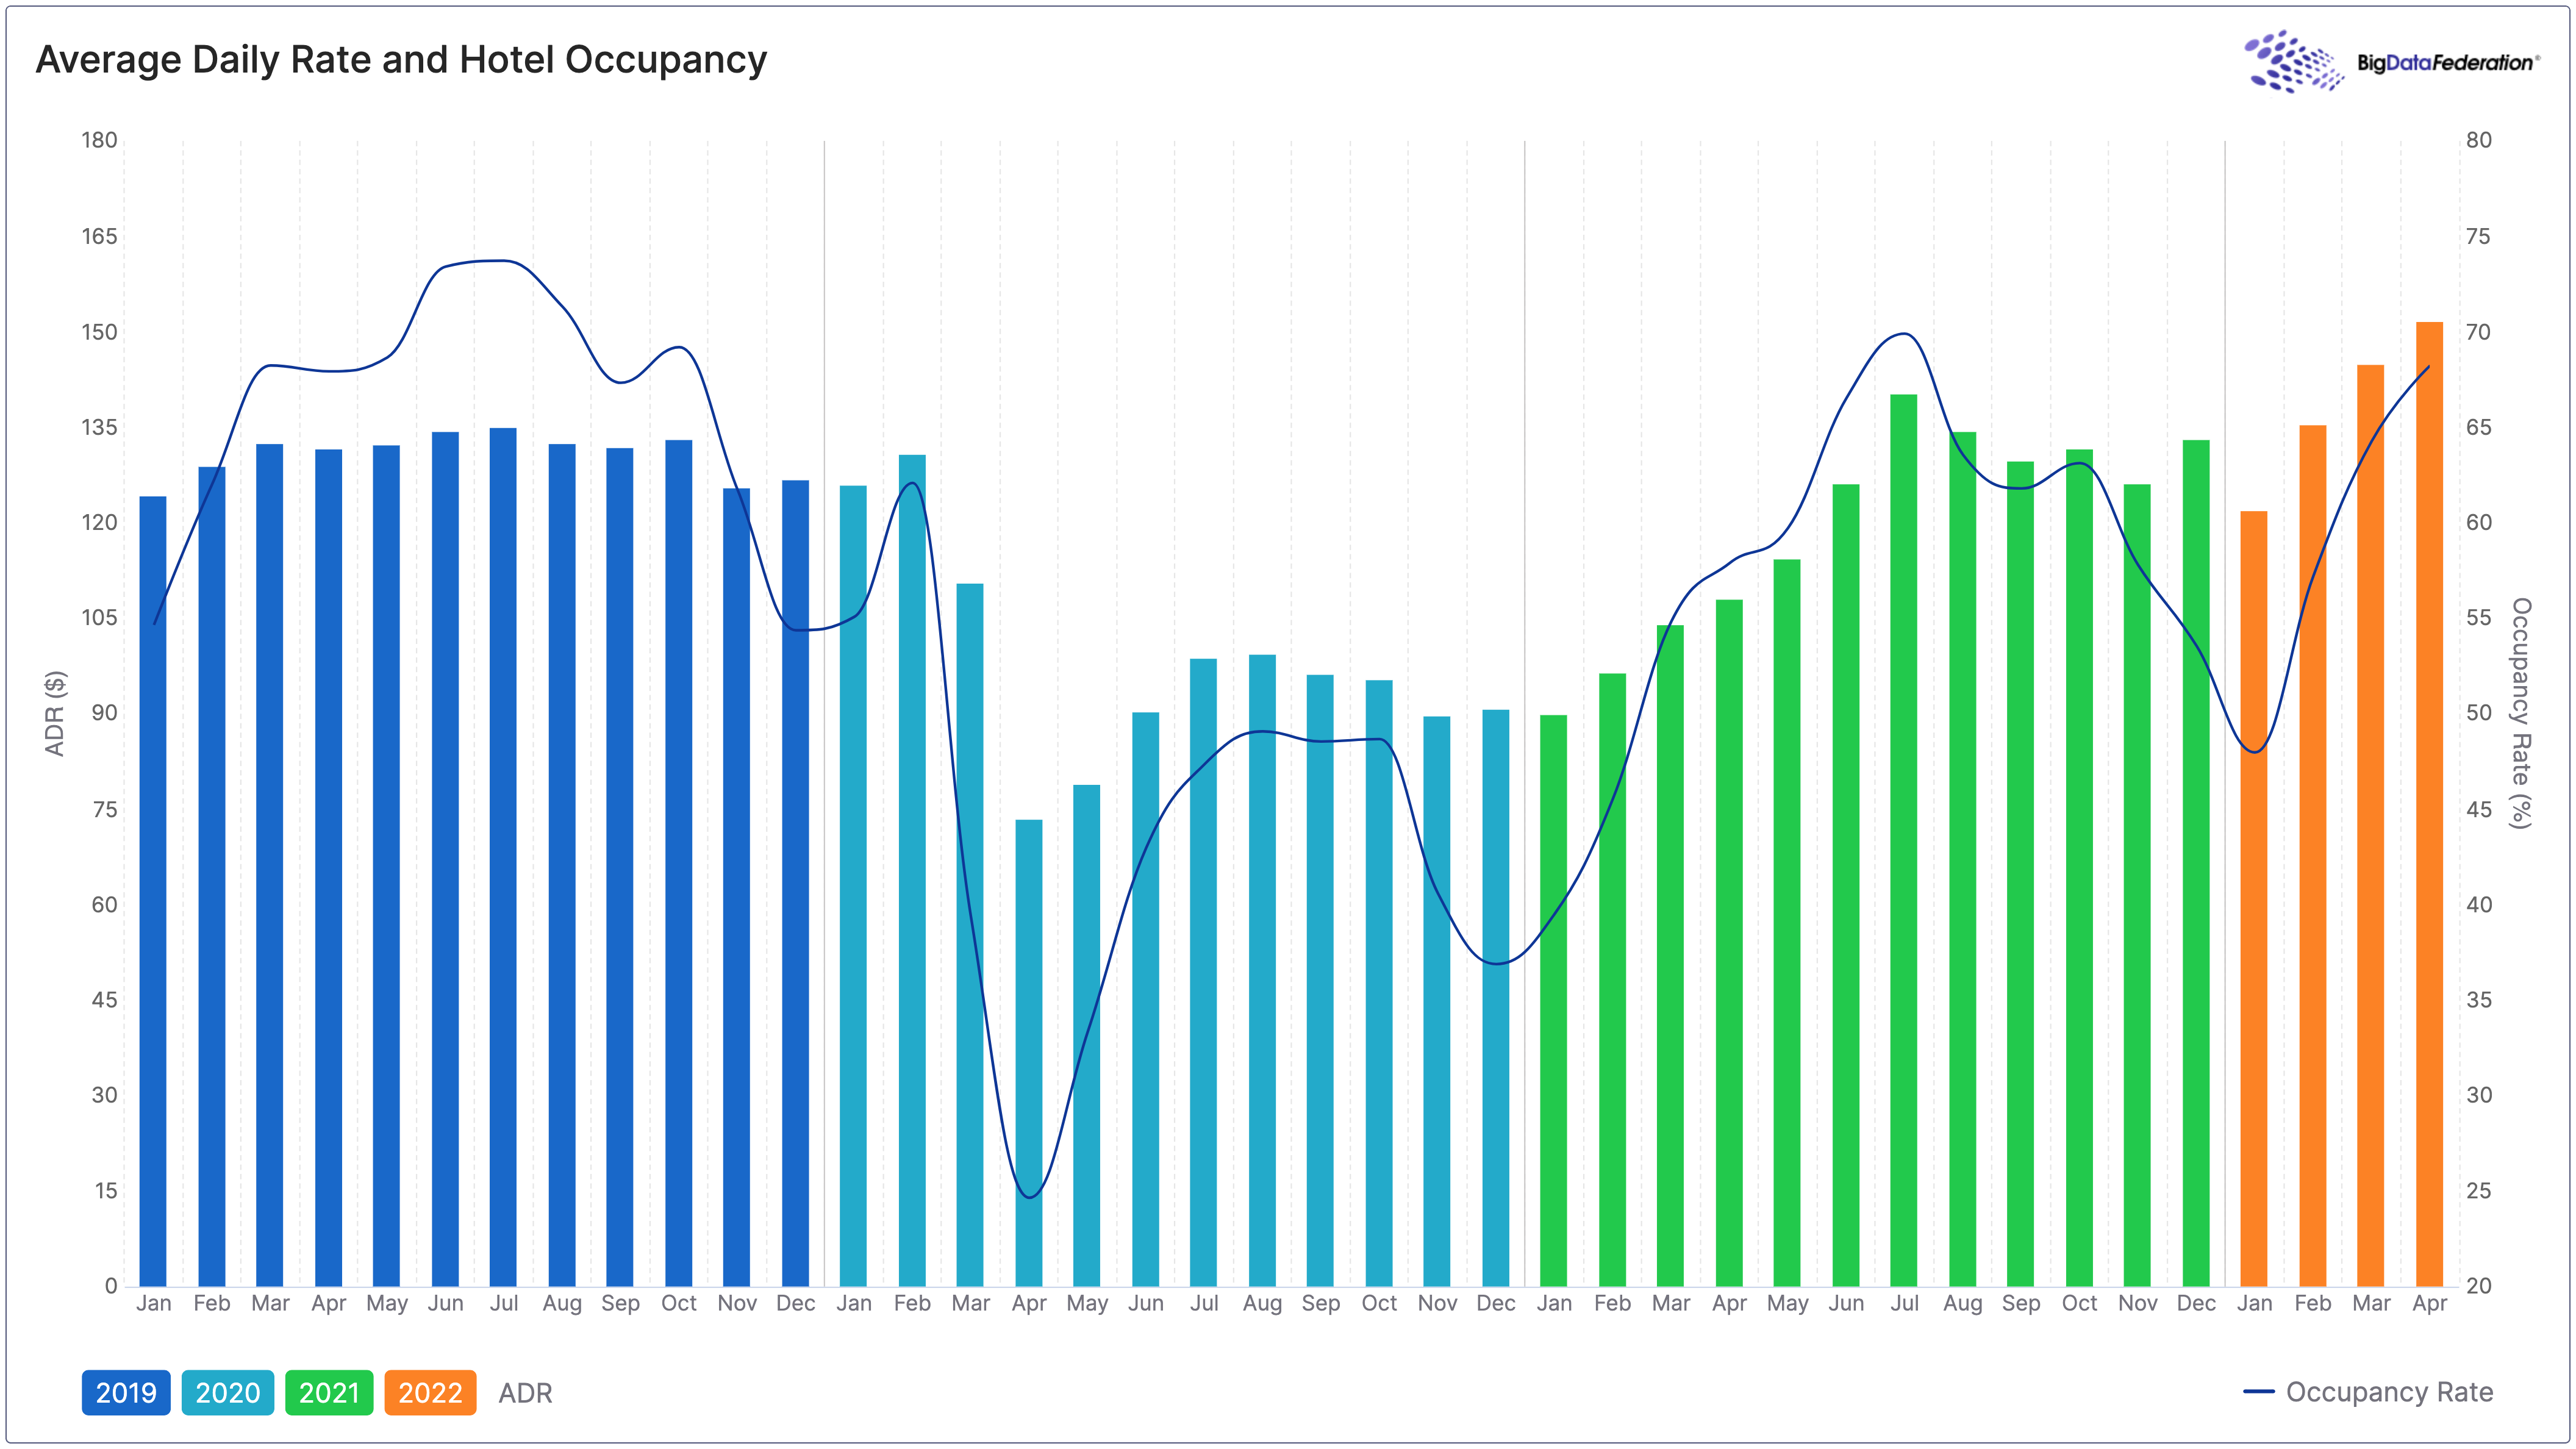
Air travel increased every month since January (+6% MoM in February and +23% MoM in March) – a time of year typically considered an off-season. Also defying seasonal trends is hotel occupancy which has been steadily increasing since January and in the first week of April exceeded pre-pandemic norms. In response to growing demand, average daily rates for hotel rooms have steadily climbed from January, and in March were significantly above pre-pandemic levels (+9.4% YoY33). The supply of hotel rooms has likewise expanded, registering +4.8% YoY3 in March.
Closing thoughts
It is important to note that a slowdown in 1Q22 is not an indicator of stagnation but rather the result of an economy in transition. We observe an effect akin to 3Q21 when the slowdown in goods was offset by a less striking uptick in services. Similarly, in 1Q22, this awkward adjustment makes it appear as though overall consumption and thus economic growth is slowing; hence our estimate for 1Q22 of below 2% growth. However, the potentially waning impact of the pandemic combined with pent-up demand for leisure and recreation should lead to aggressive services consumption growth mid-year. We expect fluctuations in GDP growth to even out towards the end of 2022, assuming the economy fully evolves into a post-COVID normality.
1Black Swan is an occurrence or phenomenon that comes as a surprise because it was not predicted or was hard to predict
2Excludes food services and drinking places, grocery stores, and gas stations
3YoY3 = comparisons to March 2019
Published by Big Data Federation · All insights · Subscribe to Insights