New Home Sales Rise
By Big Data Federation, Inc.

-
Existing home sales plunged to six-month lows amidst higher mortgage rates
-
In contrast, new home sales continued to rise due to better supply and reduced prices
-
New homes now represent a larger share of single-family home sales than before
Mortgage rates, measured by the thirty-year fixed rate, continued to increase (2% MoM/ 170% YoY/46% YoY4). Homeowners opted to hold onto their current properties, locked in by comparably lower mortgage rates. As such, counts of new listings for existing homes dropped (-3% MoM/ -26% YoY/ -28% YoY4). Not only has the upward trajectory of mortgage rates hampered new listings, but inventory also appeared stronger as existing homes sat on the market longer (7% MoM/ 1% YoY/ -43% YoY4).
|
Data (April) |
MoM |
YoY |
YoY4 |
|
30-year Fixed Rate Mortgage |
2% |
170% |
46% |
|
Existing Homes: New Listings |
-3% |
-26% |
-28% |
|
Existing Homes: Inventory |
7% |
1% |
-43% |
|
Existing Homes: Median Sales Price |
4% |
-2% |
46% |
|
Existing Homes: Sales |
-3% |
-23% |
-18% |
|
New Homes: Inventory |
0% |
0% |
30% |
|
New Homes: Median Sales Price |
-8% |
-8% |
24% |
|
New Homes: Sales |
4% |
12% |
-2% |
Source: Big Data Federation, Inc.
Constrained inventory helped support existing homes' median sales price (4% MoM/ -2% YoY/ 46% YoY4). Persistent reluctance to sell has led to a prolonged nationwide decrease in existing home sales, plummeting to a six-month low (-3% MoM/ -23% YoY/ -18% YoY4). On the flip side, the unique market landscape presented opportunities for homebuilders. Prospective homebuyers are more likely to purchase new homes.
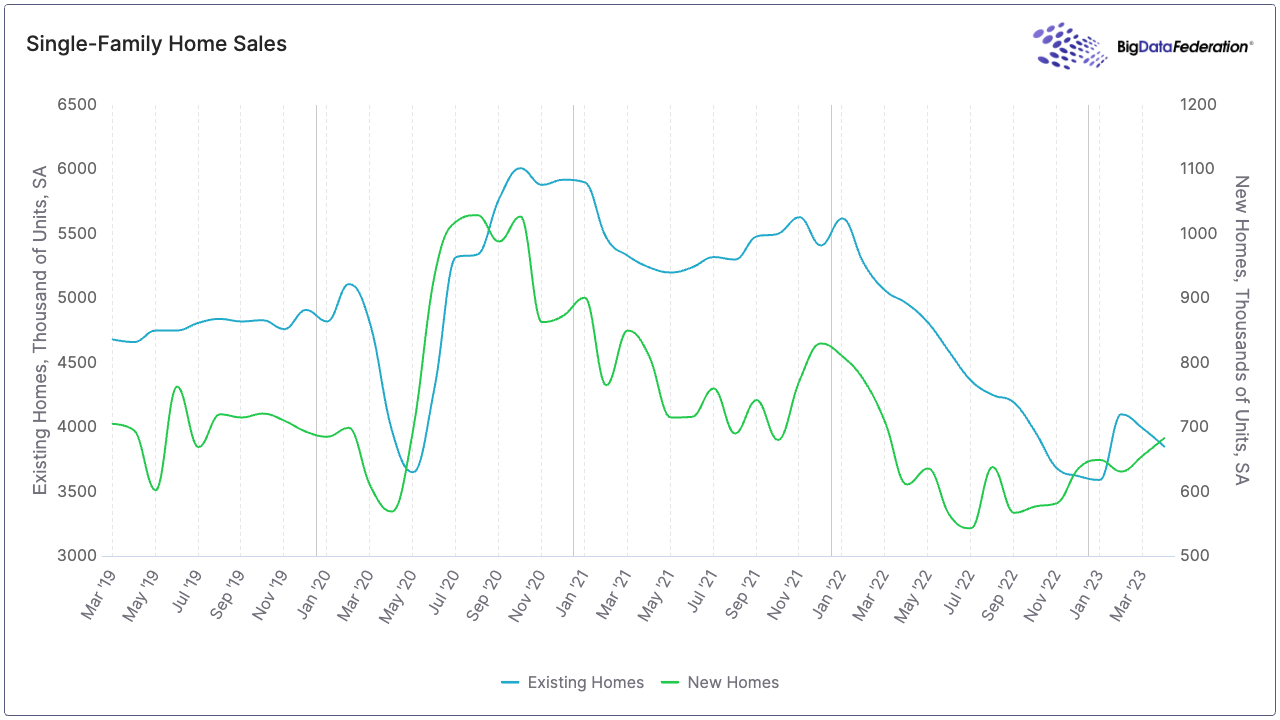 Driving forces behind this trend are better supply (30% YoY4) and substantial incentives offered by homebuilders. Initiatives such as mortgage rate buydowns, coverage of closing fees, and other discounts have reduced new home prices, although it remains elevated compared to pre-pandemic norms (-8% MoM/ -8% YoY/ 24% YoY4). Unlike existing home sales, new home sales continue to rise steadily (4% MoM/ 12% YoY/ -2% YoY4). Newly constructed homes currently represent a larger share of single-family home sales in contrast to the historical average.
1YoY4 = comparison with pre-pandemic 2019
Published by Big Data Federation · All insights · Subscribe to Insights